
Table Styles
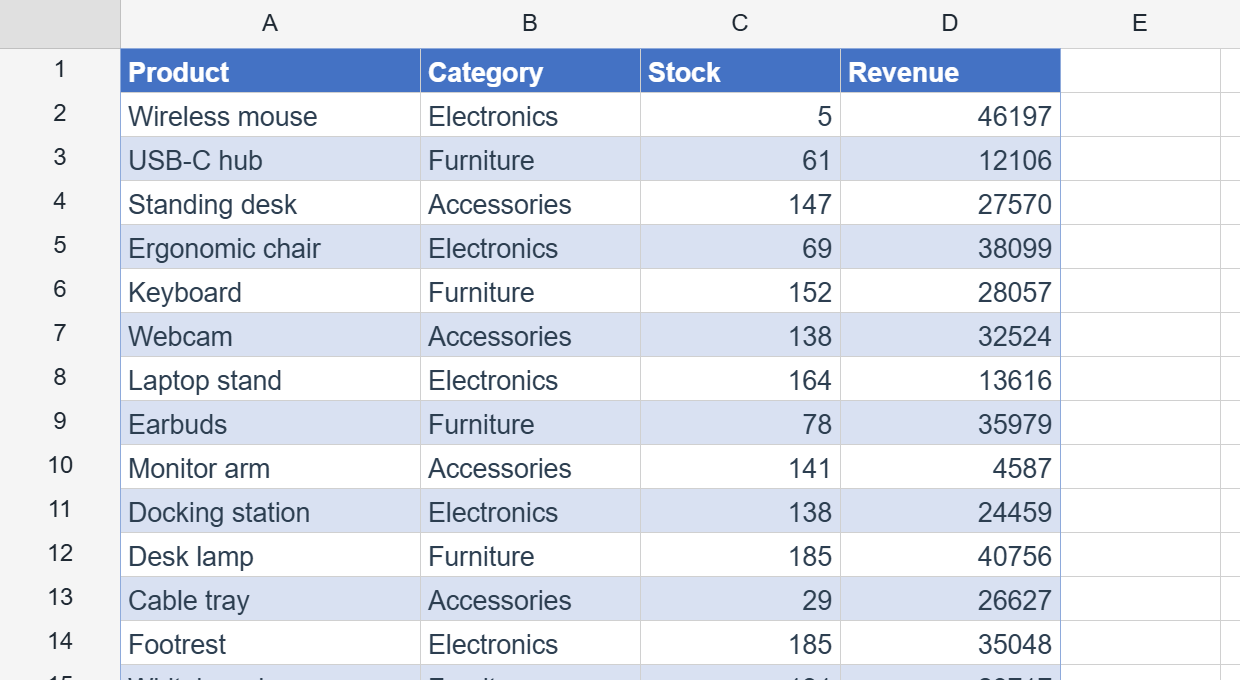
Since v1.4.0 you can turn a range into a live Excel-style table (a ListObject) with a built-in banded style. The styling is a computed overlay — banded rows and columns re-flow automatically as the table grows or shrinks, and it is not baked into individual cell formatting.
Note: Creating and styling tables is a Pro feature. Reading tables (
getTable,getTables,getTableAt) is available in Lite, so tables authored in Pro — or imported from xlsx — still surface in the free tier.
Formatting a range as a table
The most direct route is RangeHandle.formatAsTable:
import { createReogrid } from '@reogrid/pro'

const grid = createReogrid({ workspace: '#app' })
const ws = grid.worksheet

// A1:D20 — first row is the header
const table = ws.range('A1:D20').formatAsTable({ style: 'TableStyleMedium9' })
console.log(table.name)  // 'Table1'
Or call addTable with an explicit RangePosition (top-left + counts):
const table = ws.addTable(
  { row: 0, col: 0, rows: 20, columns: 4 }, // A1:D20, includes the header row
  { name: 'Sales', style: 'TableStyleMedium2', showRowStripes: true },
)
Both return a TableDefinition describing the table (id, name, full range including headers, derived columns, and style info).
AddTableOptions
| Option | Type | Default | Description |
|---|---|---|---|
name | string | auto (Table1, Table2, …) | Unique-in-workbook internal name. |
style | string | 'TableStyleMedium2' | Built-in OOXML style name (see below). '' = no style, Excel’s “None”. |
headerRowCount | 0 | 1 | 1 | Whether the first row is a header. |
showRowStripes | boolean | style default | Banded (striped) rows. |
showColumnStripes | boolean | style default | Banded columns. |
showFirstColumn | boolean | style default | Emphasize the first column. |
showLastColumn | boolean | style default | Emphasize the last column. |
Style names
style is an OOXML built-in table-style name. ReoGrid ships a curated subset of the standard palette:
| Family | Names |
|---|---|
| Light | TableStyleLight1 … TableStyleLight21 |
| Medium | TableStyleMedium1 … TableStyleMedium28 |
| Dark | TableStyleDark1 … TableStyleDark11 |
The name is preserved verbatim through import/export even when rendered with the fallback palette, so a table styled in ReoGrid keeps its style identity in Excel.
Banding re-flows automatically
Because the style is an overlay rather than baked-in cell formatting, the row/column stripes recompute whenever the table’s shape changes — insert a row in the middle and the alternating bands stay correct with no manual restyling. Toggle banding at any time:
ws.range('A1:D20').formatAsTable({ style: 'TableStyleMedium9', showColumnStripes: true })Reading and removing tables (Lite-readable)
ws.getTables()            // TableDefinition[] on the sheet
ws.getTable('Sales')      // by name
ws.getTableAt(3, 1)       // the table covering a cell, or undefined
ws.removeTable('Sales') // drop the table (cells keep their values)getTable, getTables, and getTableAt work in Lite, so you can detect and read tables even without a Pro license.
xlsx round-trip
Tables serialize to xl/tables/tableN.xml with their style info and column names, so they open in Excel as native tables — and Excel tables import back as ReoGrid tables. They also round-trip through ReoGrid JSON.
A table set to Excel’s “None” style is imported plain and written back without a style name (v1.7.0). Before that it came up with TableStyleMedium2’s blue header and banded rows. Create one with ws.addTable(range, { style: '' }).
Related
- Pivot Tables — summarize a table’s data into a cross-tab.
- Conditional Formatting — value-driven styling that composes with table banding.
- Cell Styles — per-cell formatting for finer control.
Sorry to hear that. What could be improved?