Live Examples
Try each demo live in the browser — click any card to open.
🧩 Feature Demos (17)
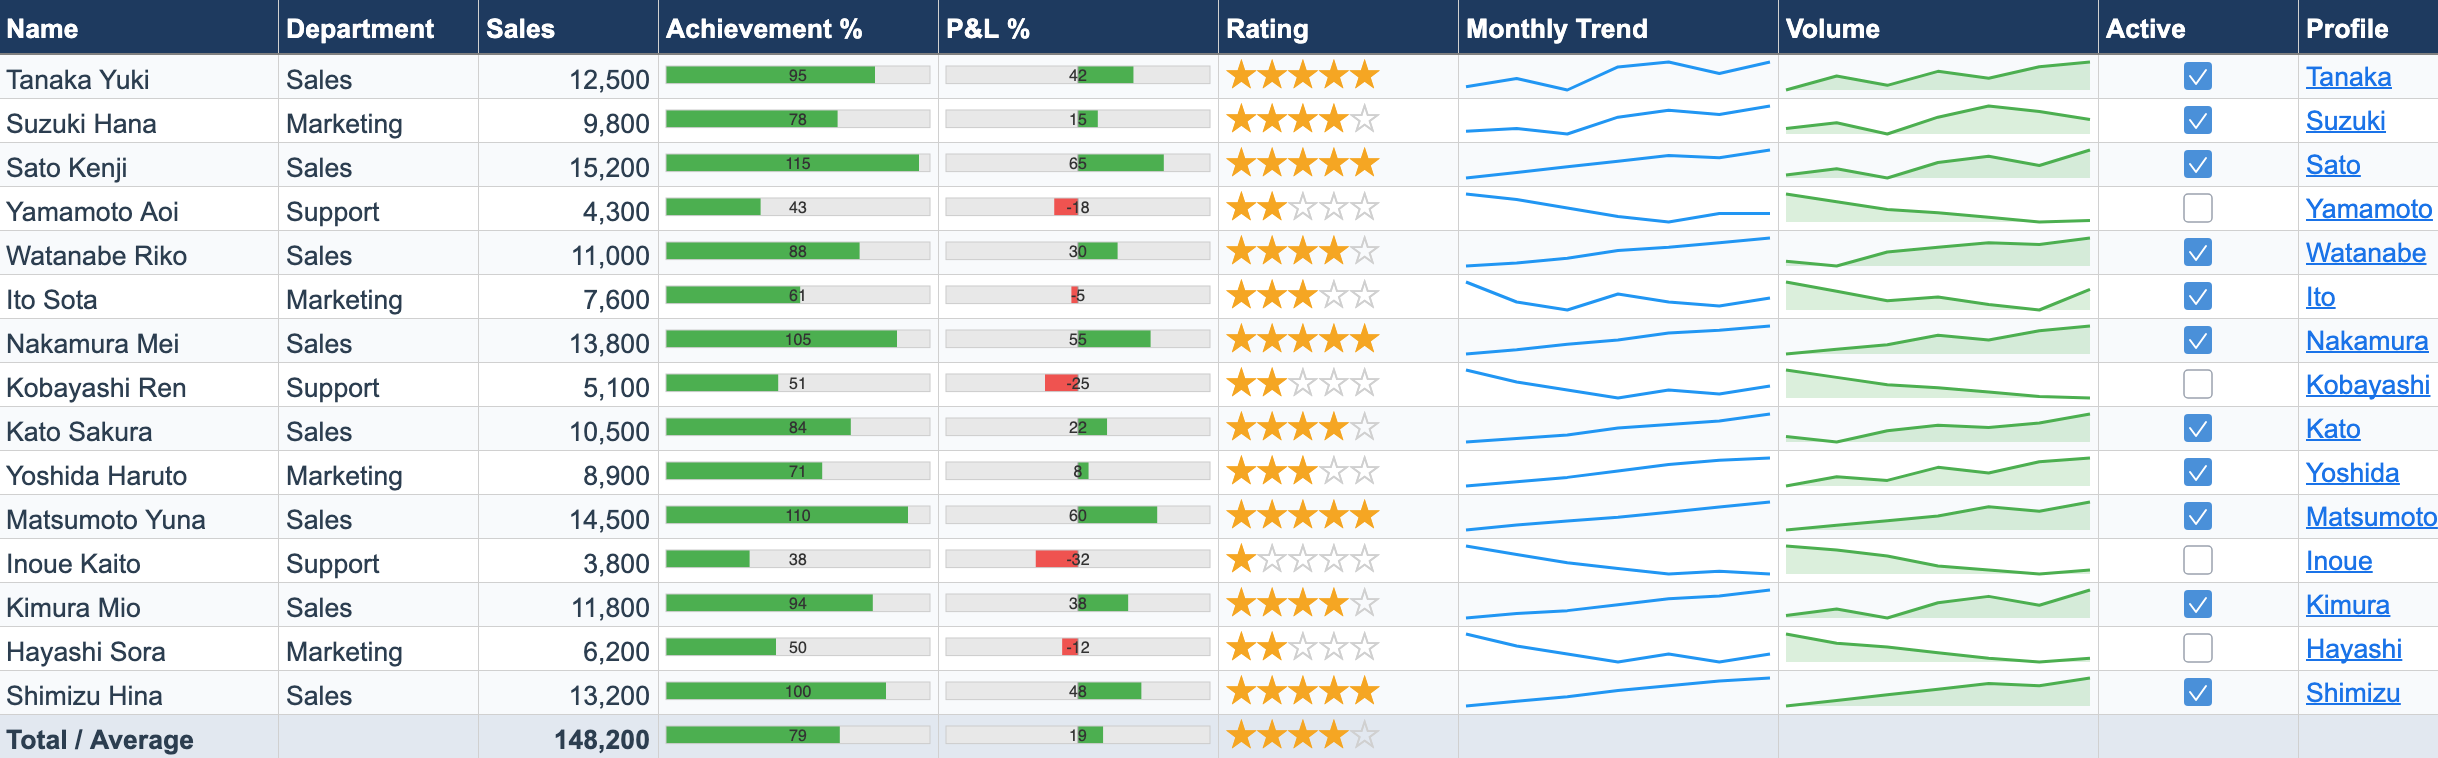
Cell Types Dashboard
PROProgress bars, star ratings, sparkline charts, checkboxes, and hyperlinks — all rendered inside spreadsheet cells.
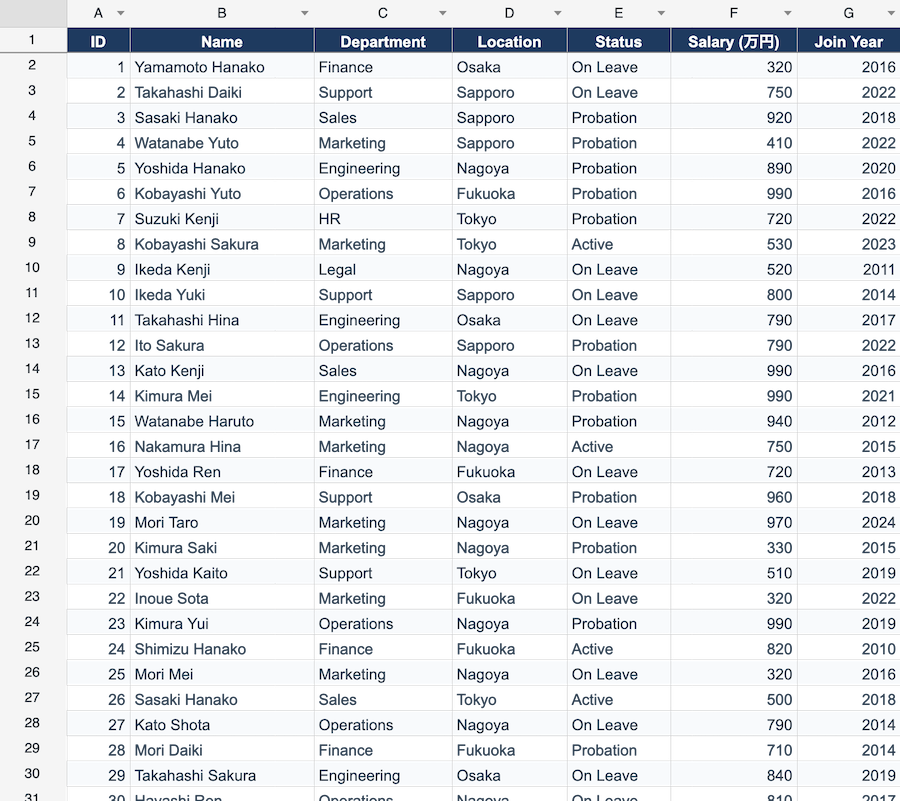
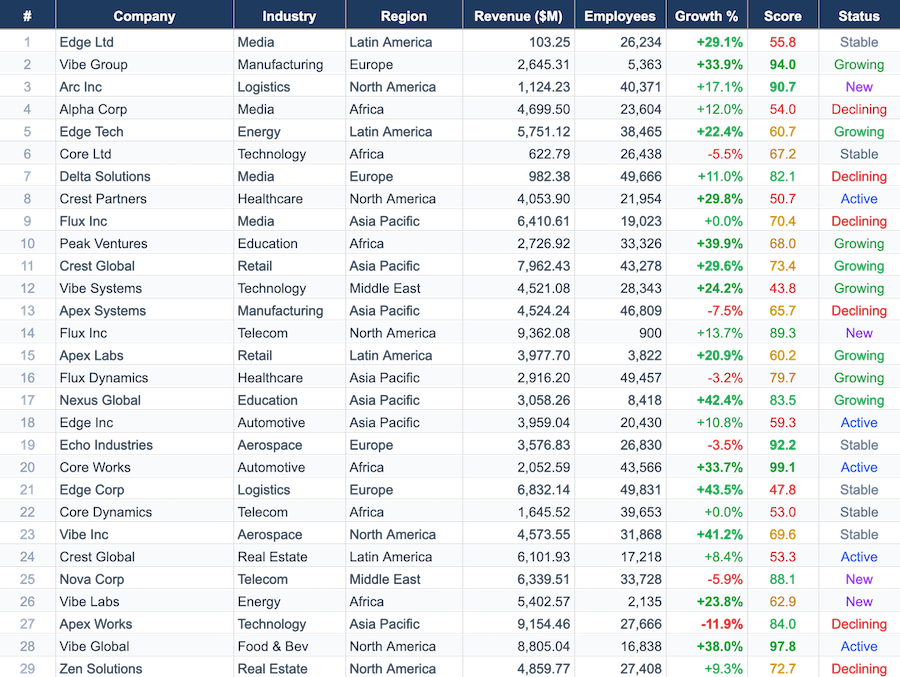
Data Filter & Sort
PROClick column header dropdowns to filter and sort rows. Switch between 300, 1K, and 10K rows to test performance.
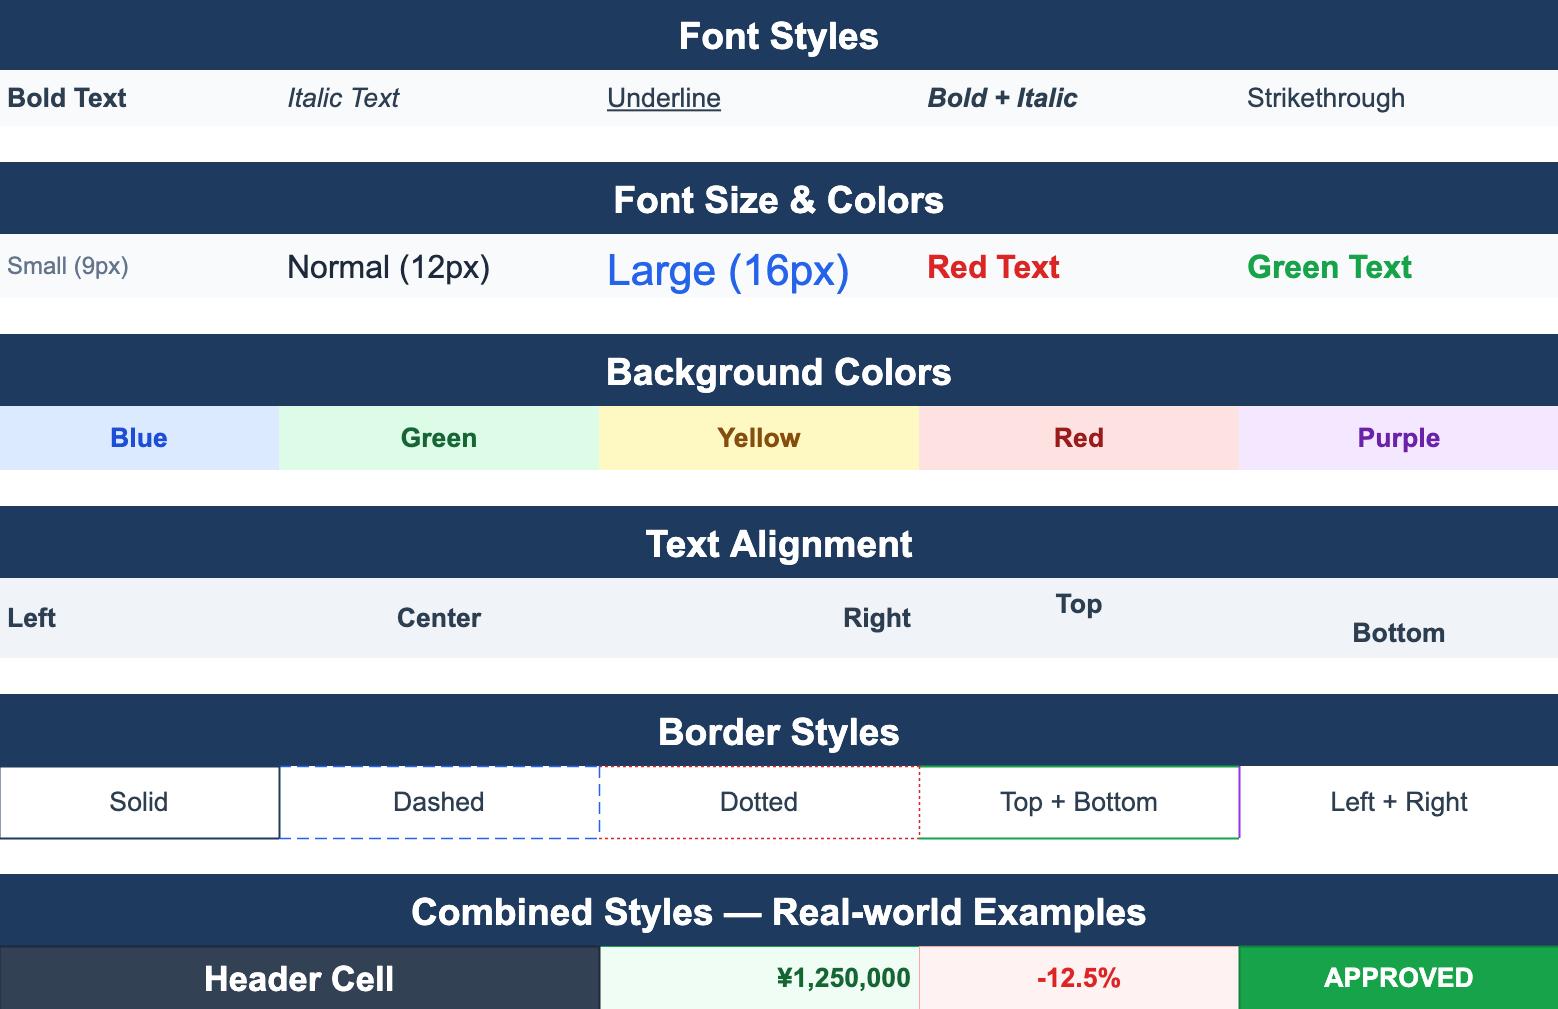
Cell Styles
Font styles, colors, backgrounds, text alignment, and border options — a showcase of the Cell Style API.
Freeze Panes
PROToggle frozen rows and columns interactively. Scroll a 50-row dataset while headers stay fixed.
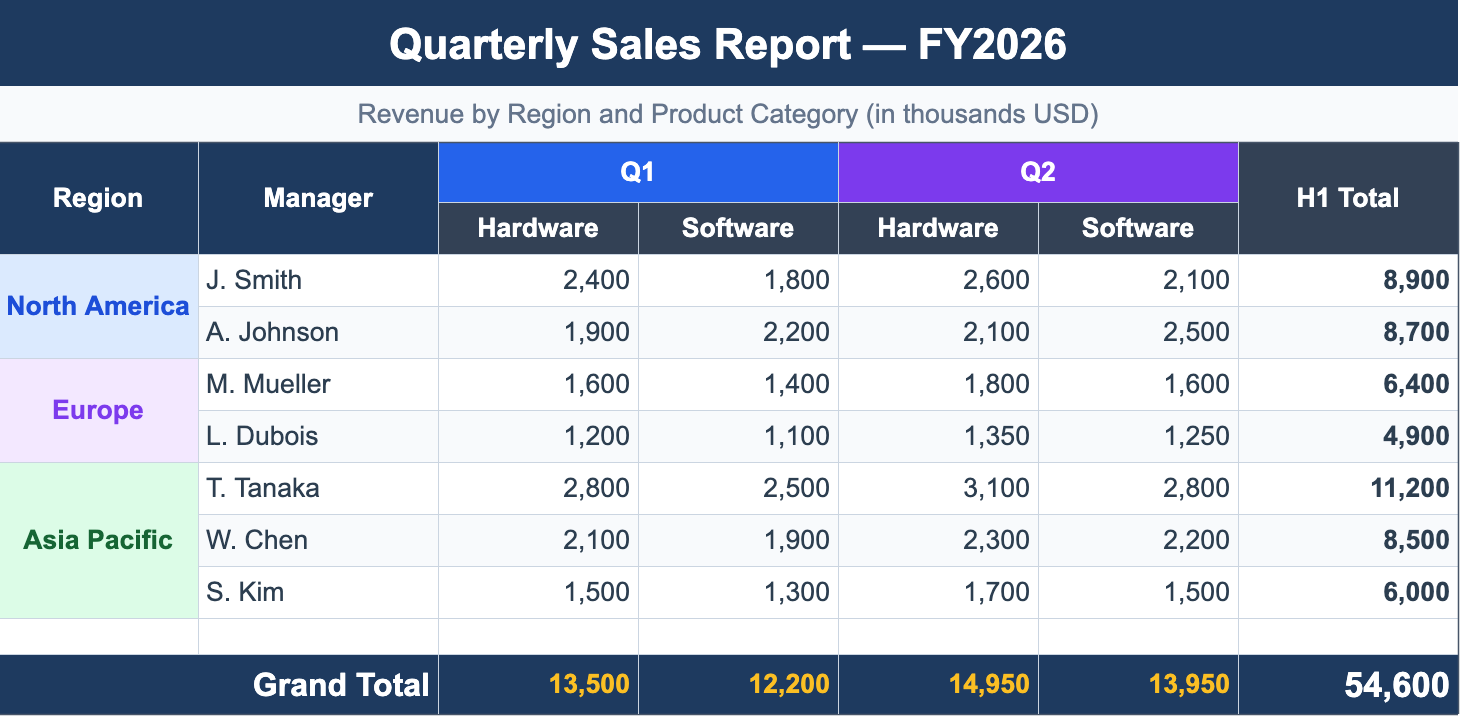
Merge & Layout
Cell merging for titles, grouped headers, side labels, and complex multi-level table layouts.
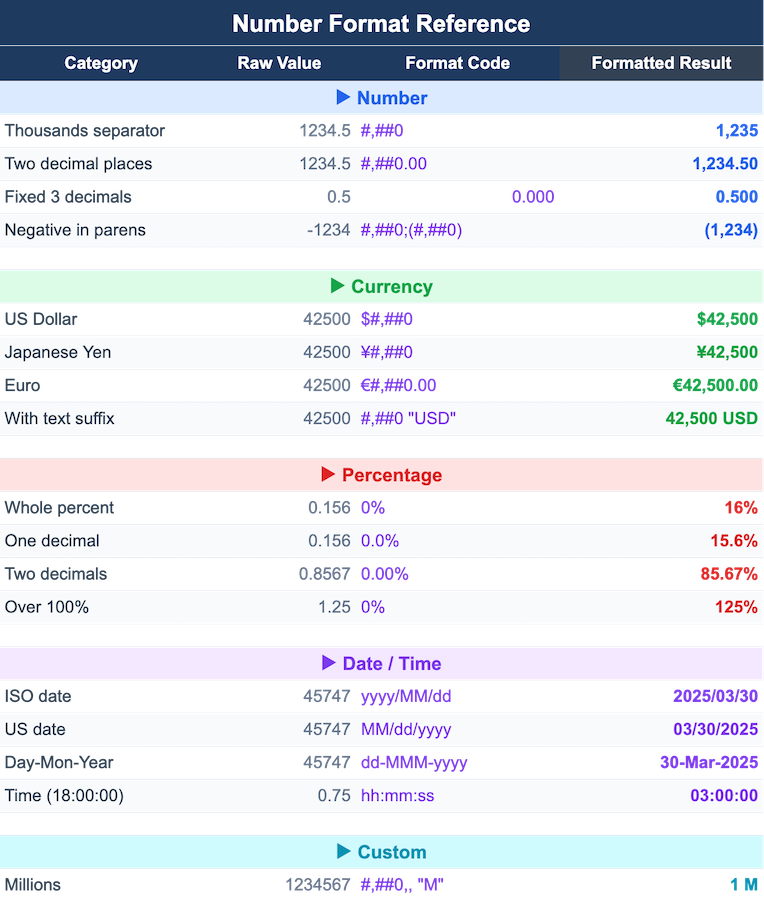
Number Formatting
Format numbers as currency, percentages, dates, and custom patterns — a reference of all supported format codes.
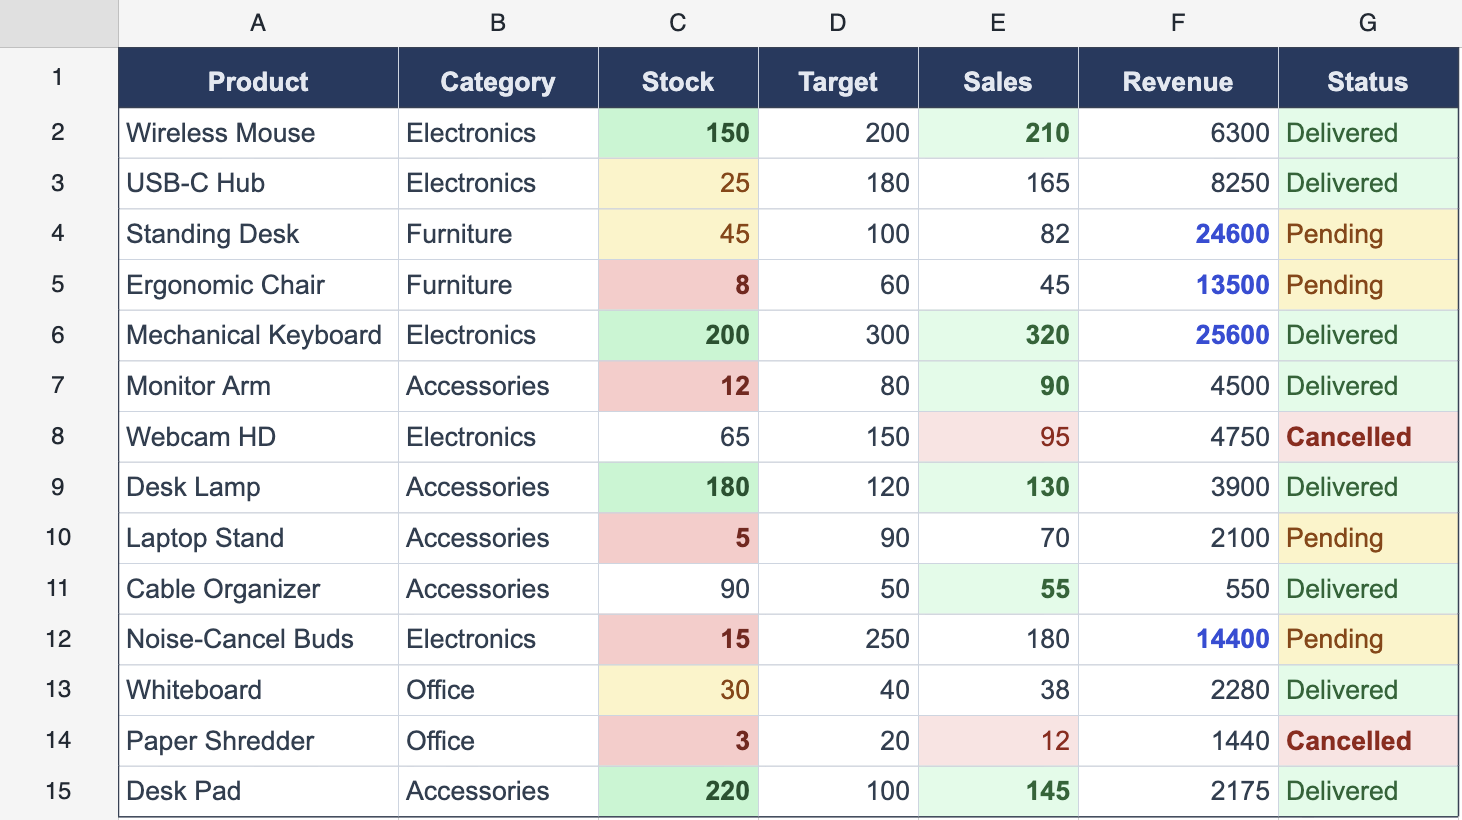
Conditional Formatting
PROValue-based cell styling with traffic-light stock levels, expression rules comparing sales vs targets, and text-match status coloring — all updating live as you edit.
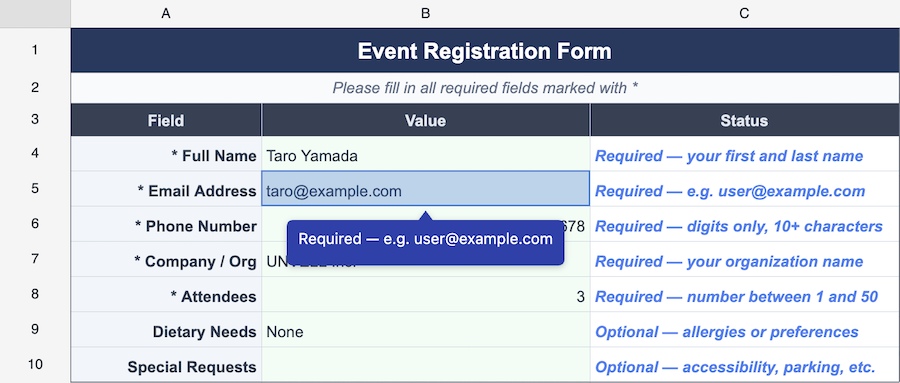
Cell Tooltip — Form Validation
PROEvent registration form with contextual tooltips: blue hints for required fields, red error messages after validation. Fill, validate, and cycle through errors interactively.
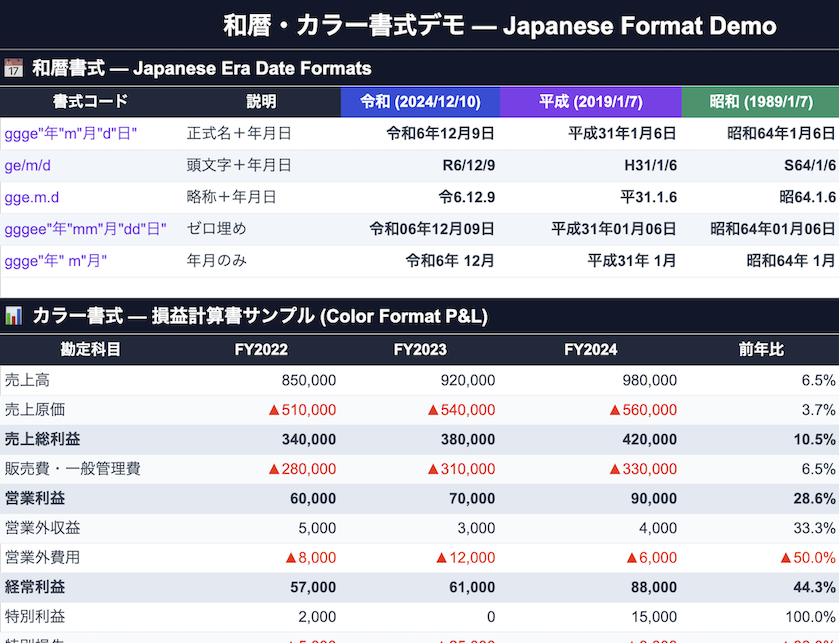
Japanese Era & Color Formats
Japanese era dates (令和/平成/昭和) and bracket color formats ([赤]/[Red]) for business documents — P&L statement demo with red-negative display.
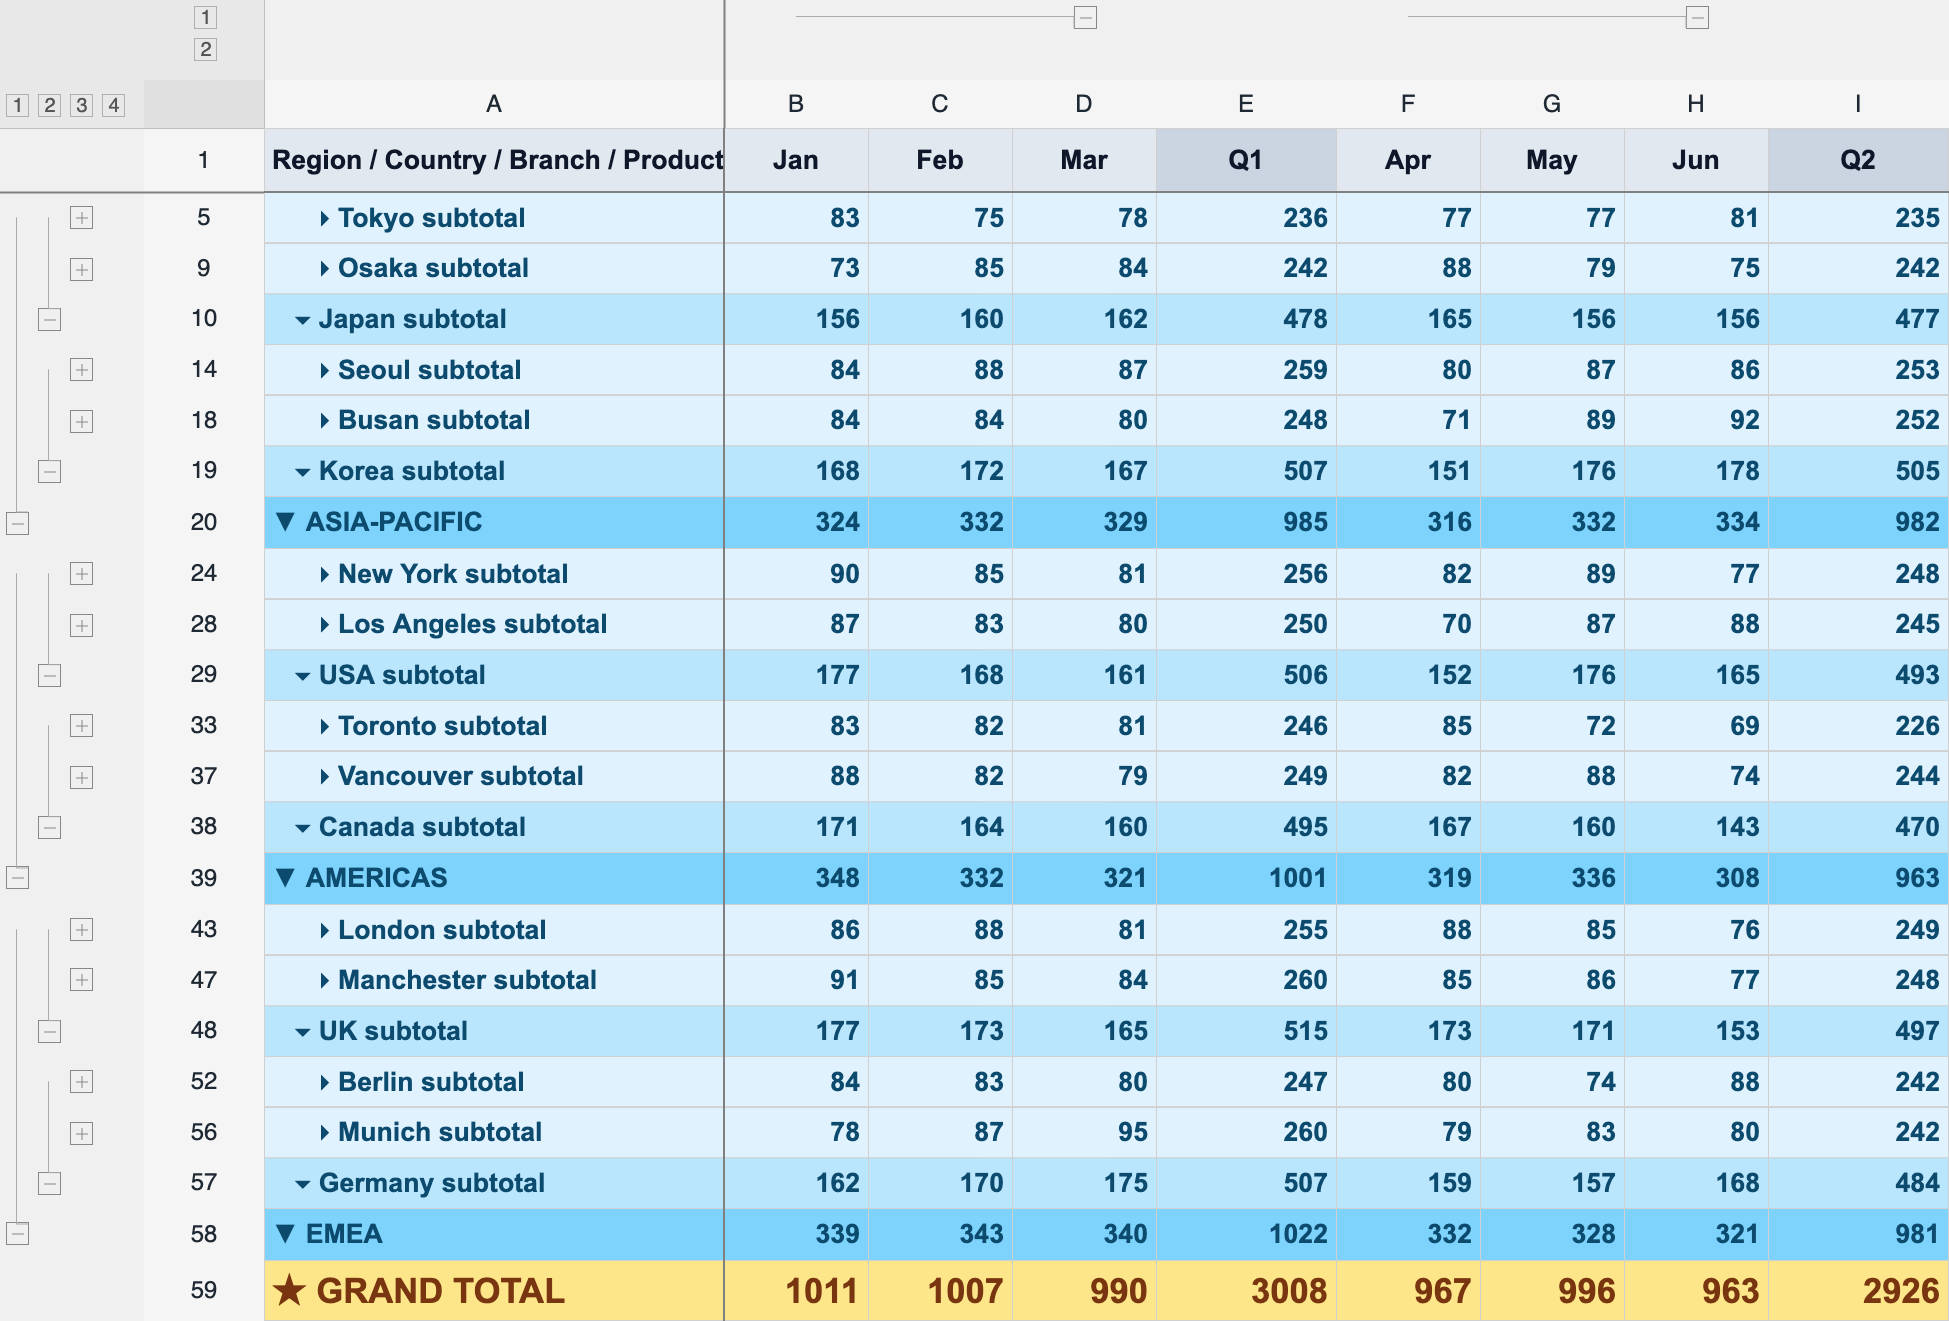
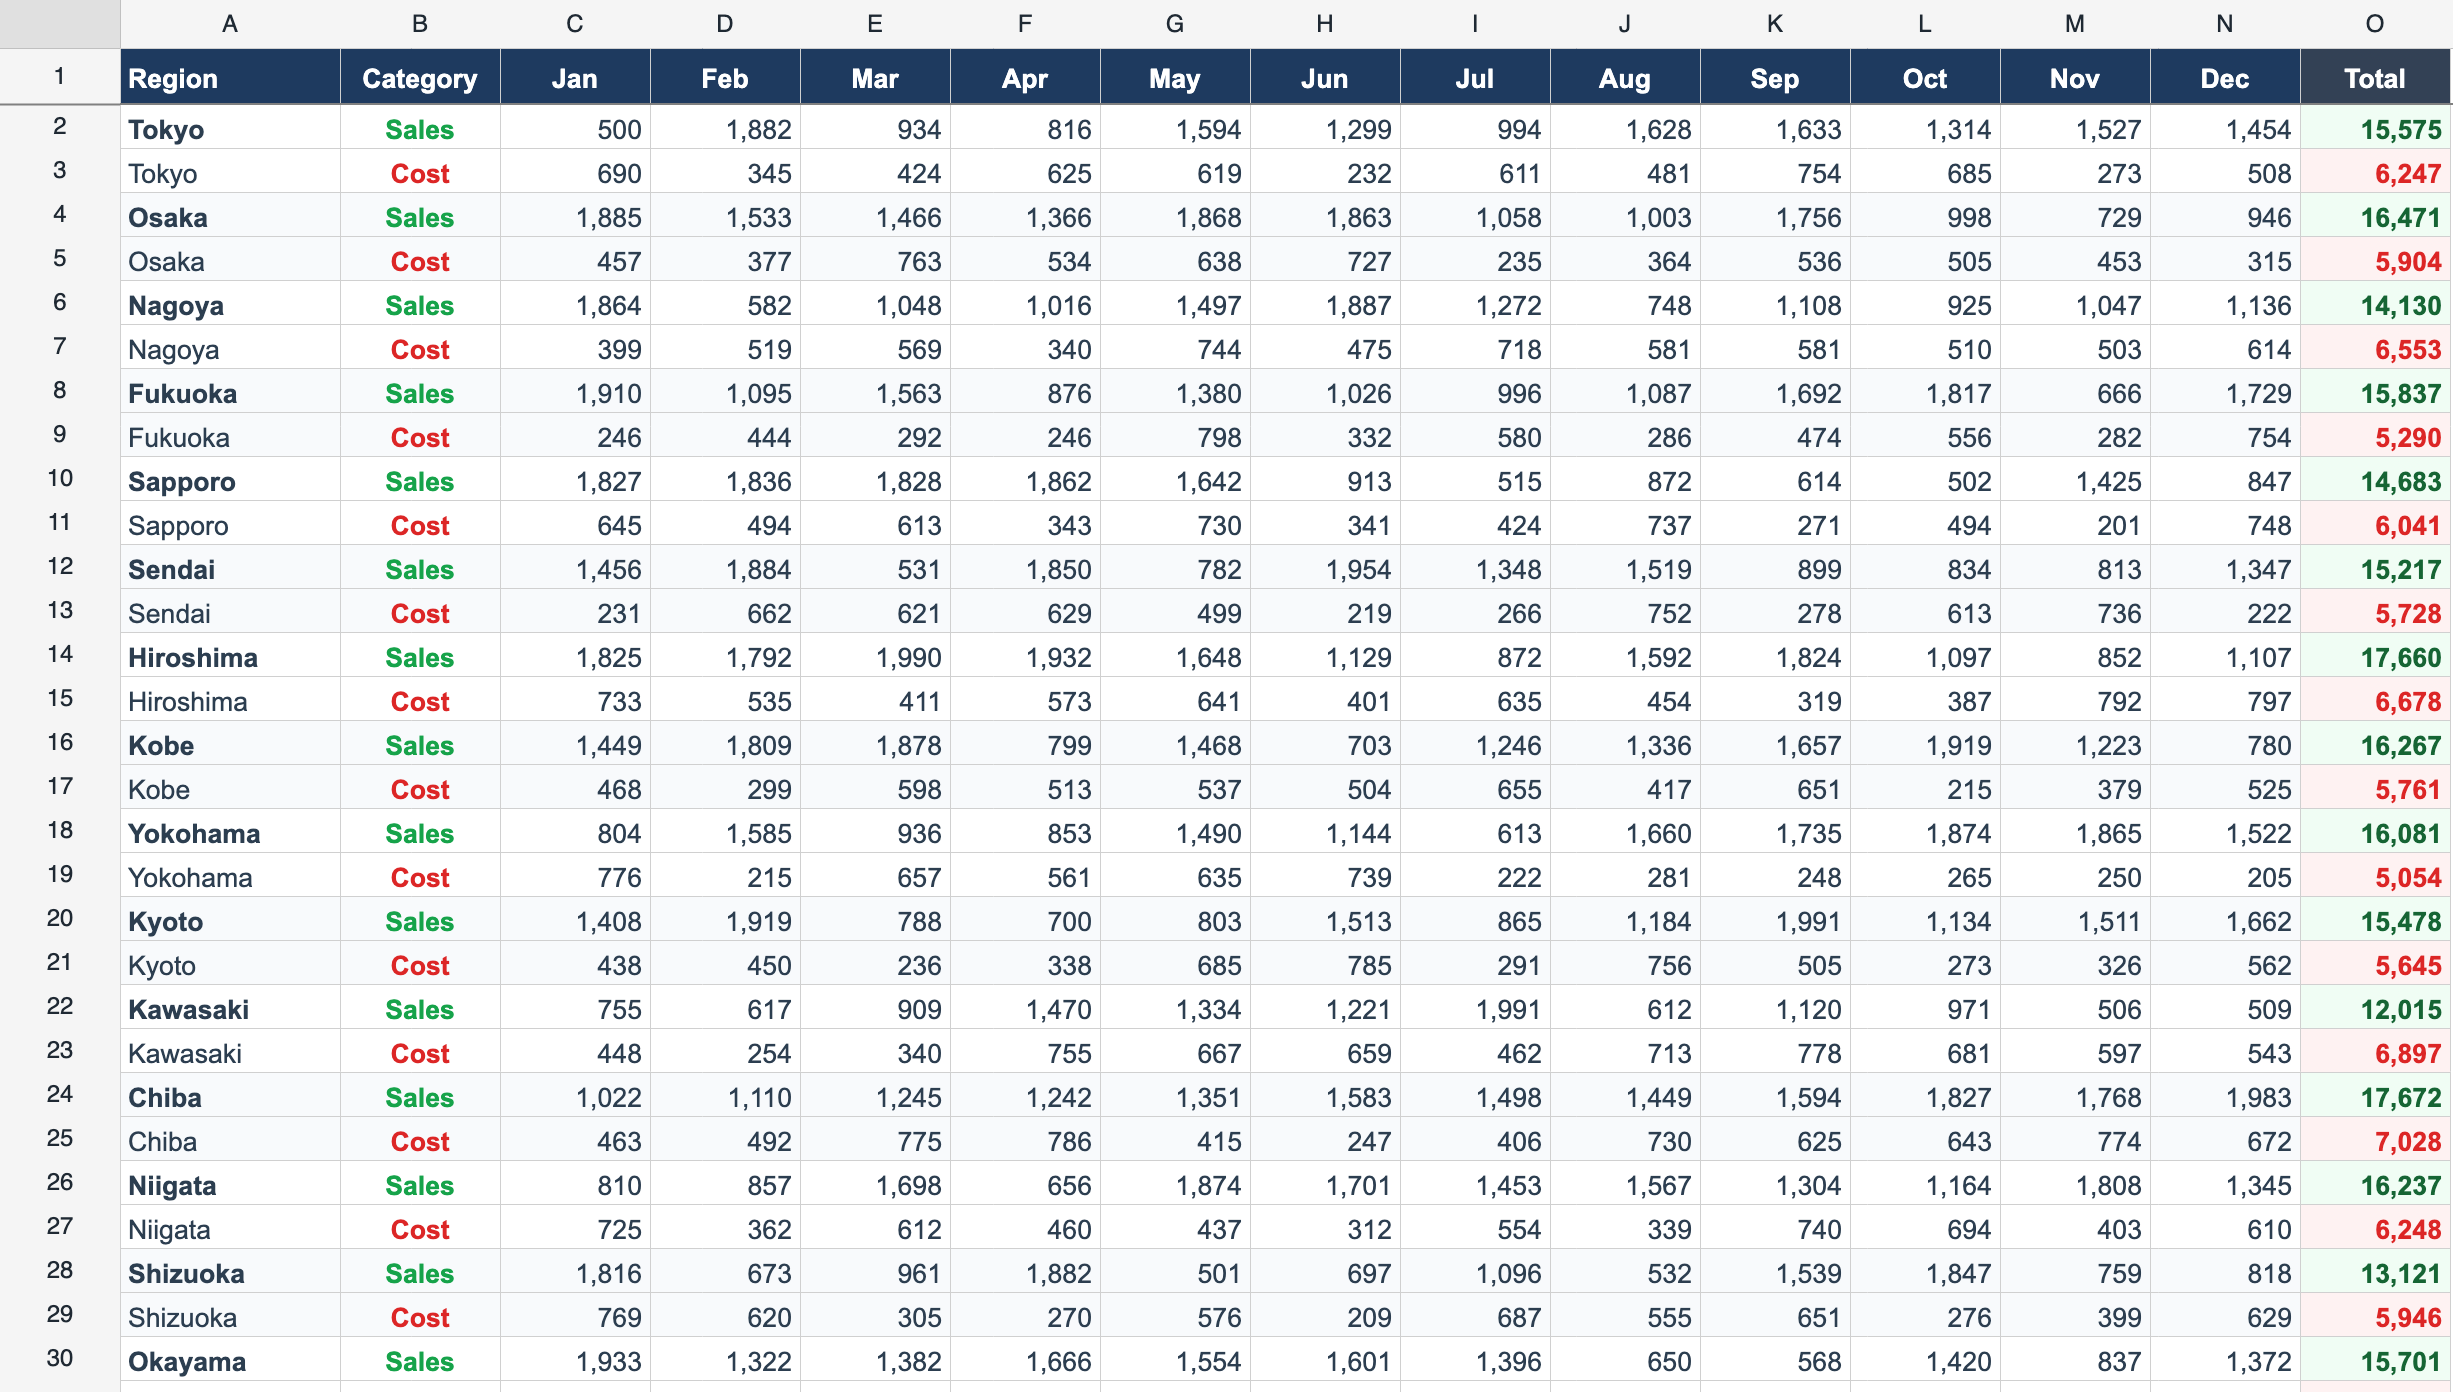
Outline (Grouping)
PRO3-level row outline (Region → Country → Branch) × 1-level column outline (quarters). All subtotals are live SUM formulas — edit any cell and watch four levels of totals update.
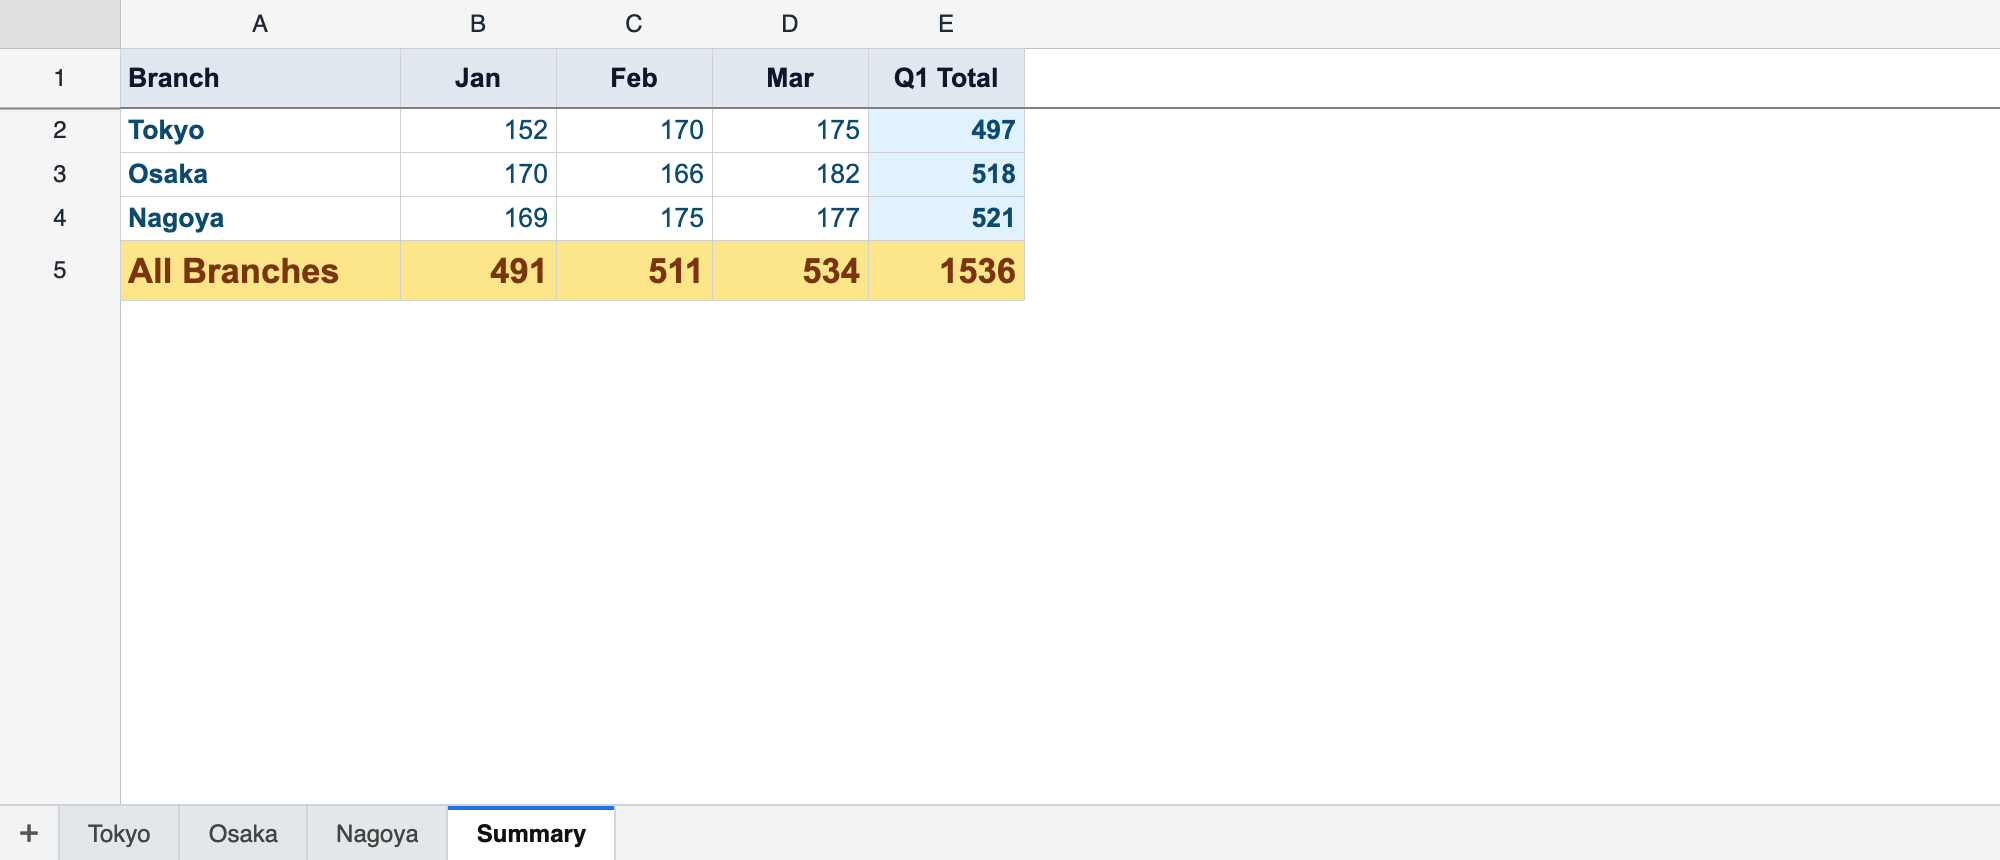
Multi-Sheet Workbook
Four sheets in one workbook with a built-in tab bar. The Summary sheet consolidates three branch sheets entirely with cross-sheet formulas (='Tokyo'!E6) — edit any branch and the totals recalculate across sheets.
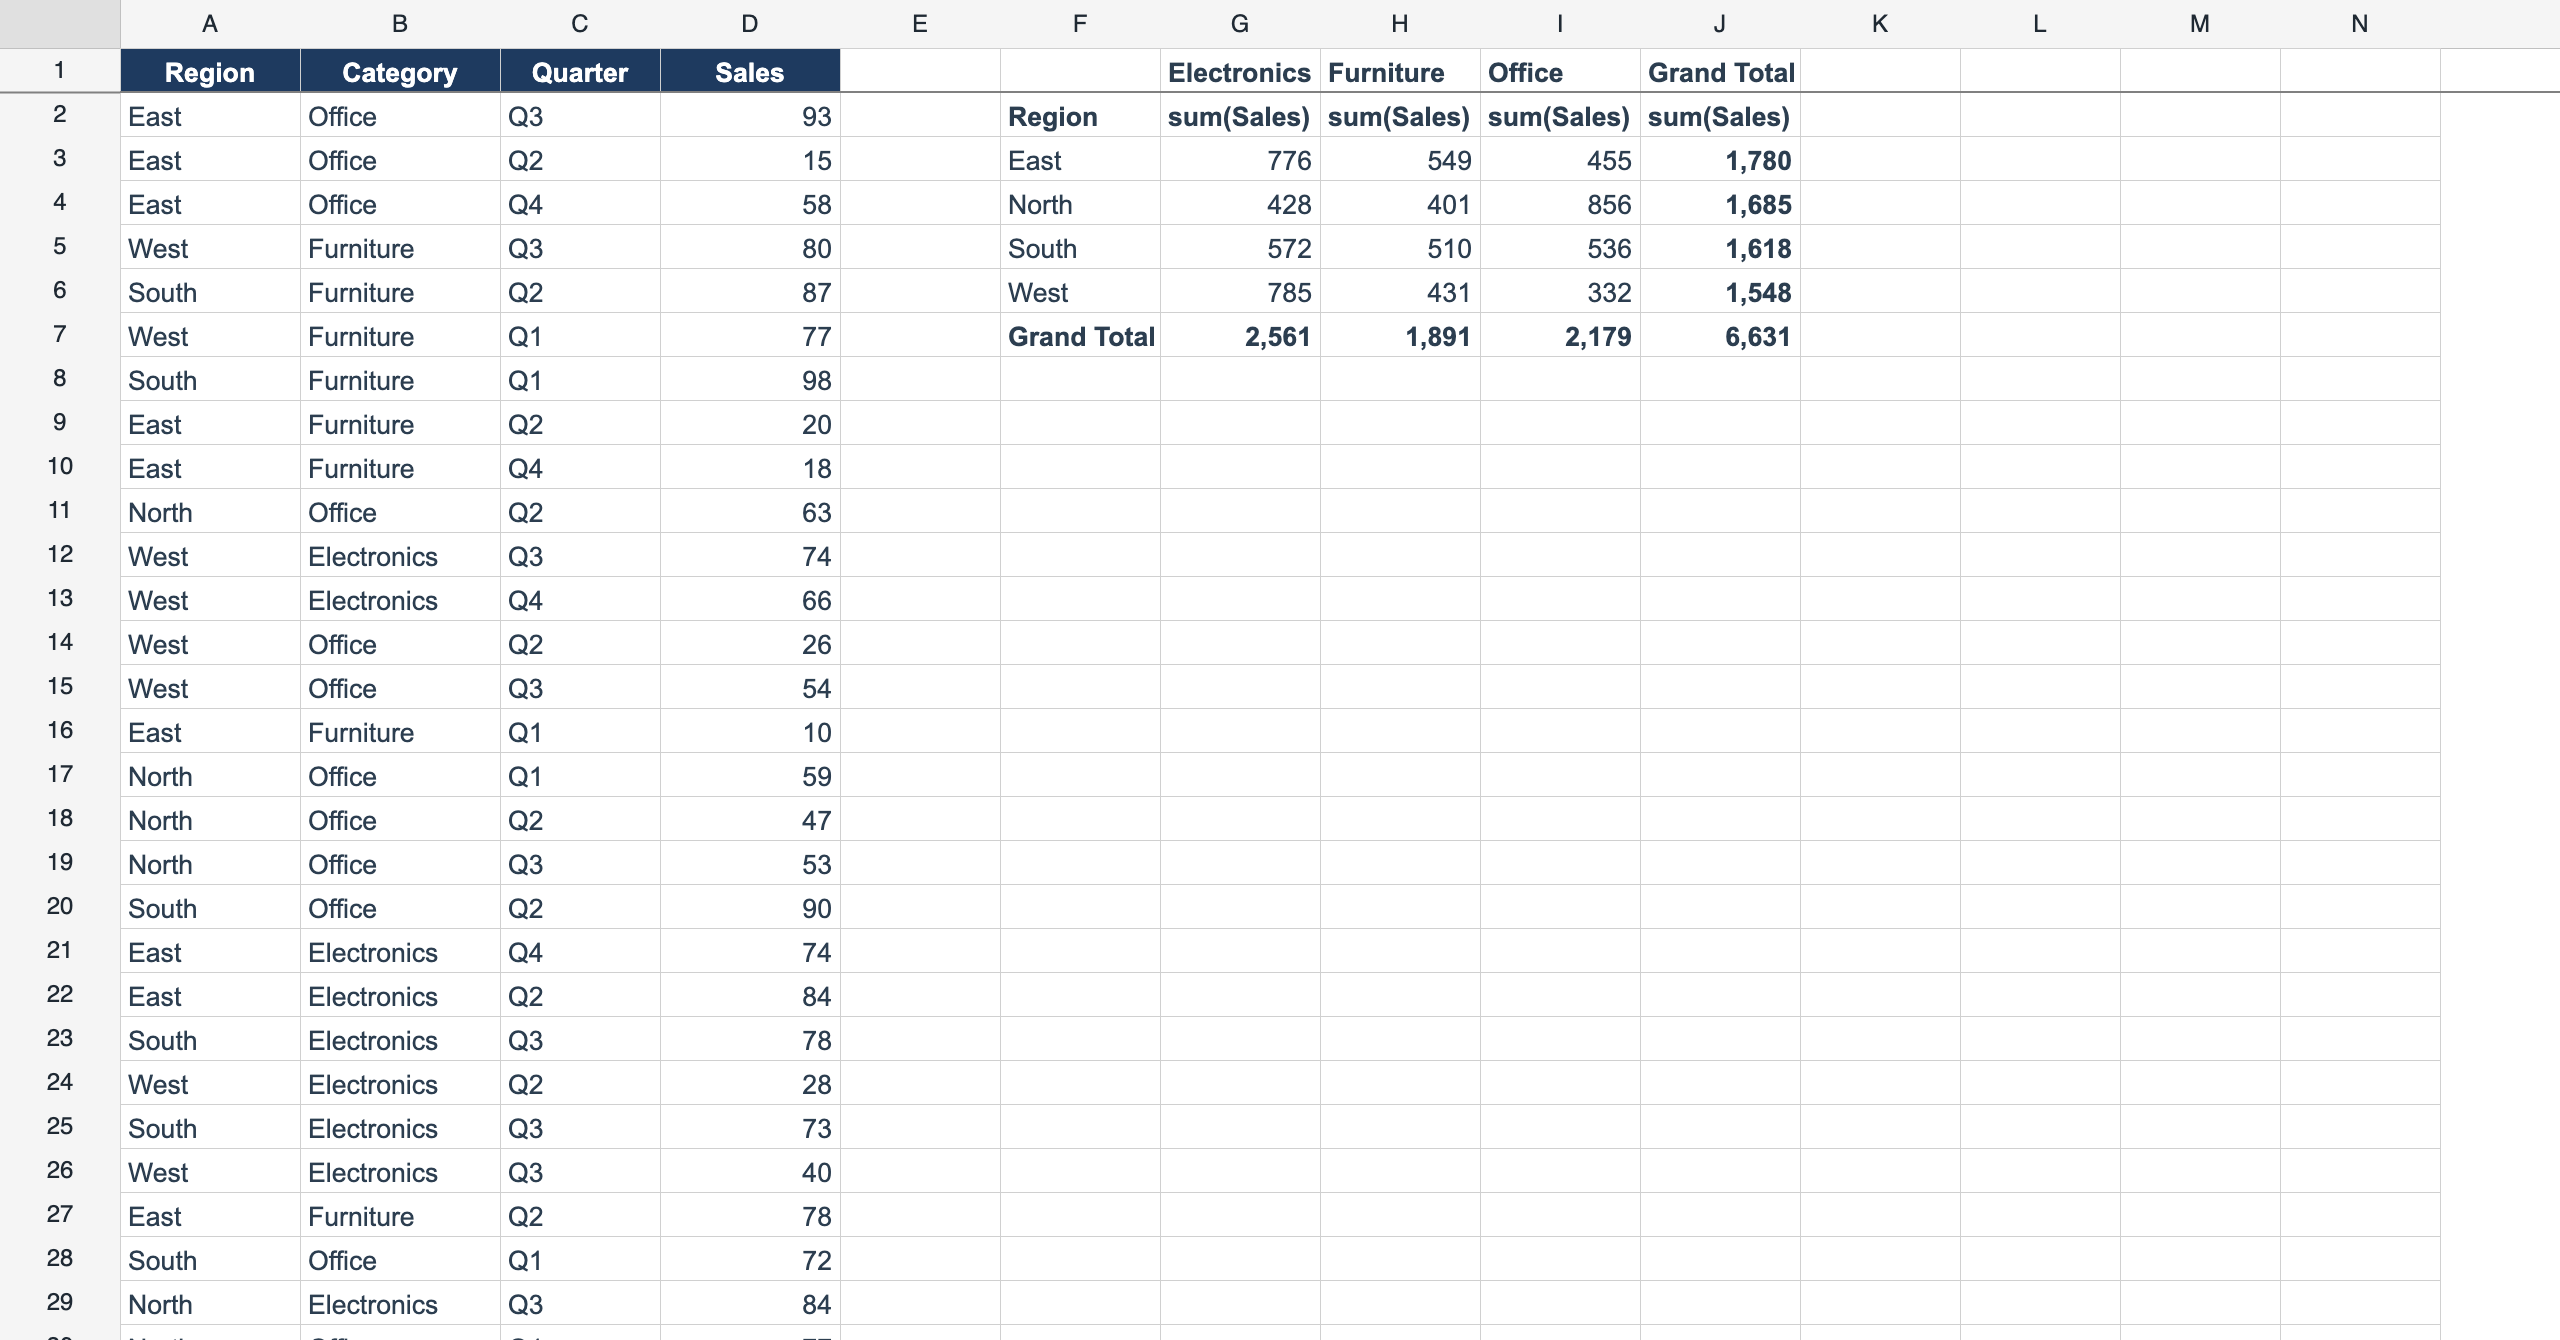
Pivot Table
PROLive, API-driven pivot tables — pick row/column fields and an aggregation (sum, average, count, min, max) computed from a source range and rendered into the grid. Edit any source value and the pivot recomputes.
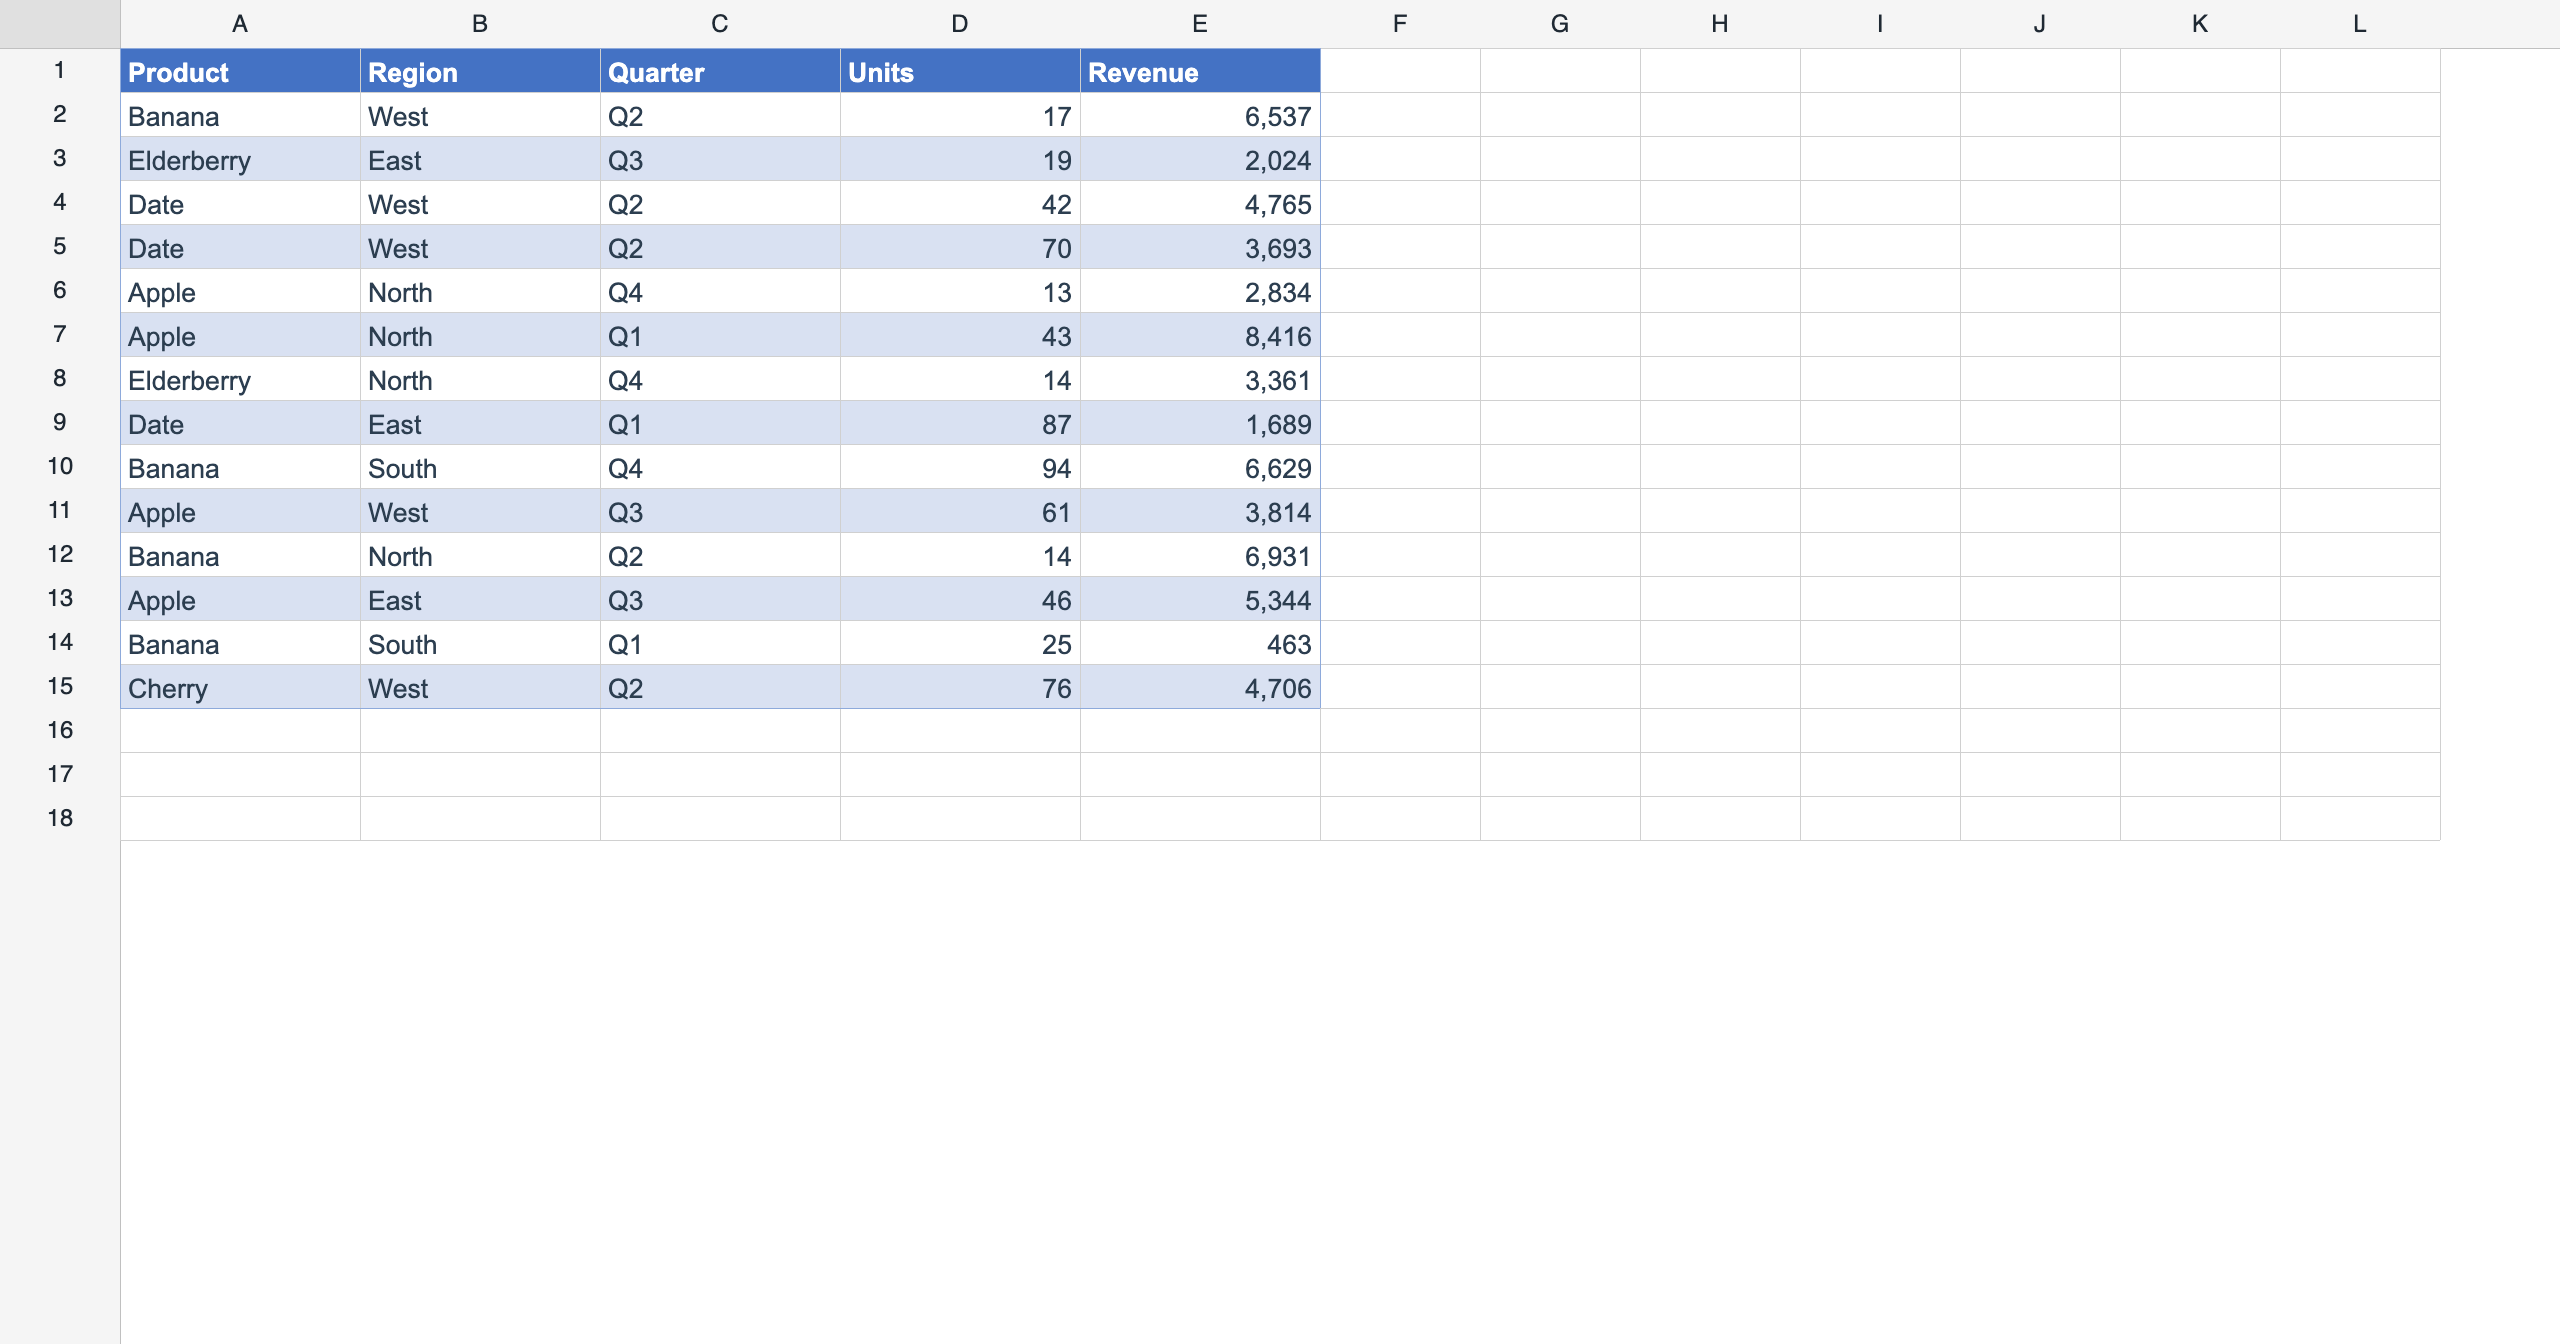
Table Styles
PROExcel "Format as Table" — built-in banded styles applied as a live overlay via range.formatAsTable(). Switch styles instantly, toggle banded rows, and insert a row to watch the banding re-flow. Round-trips as a real xlsx table.
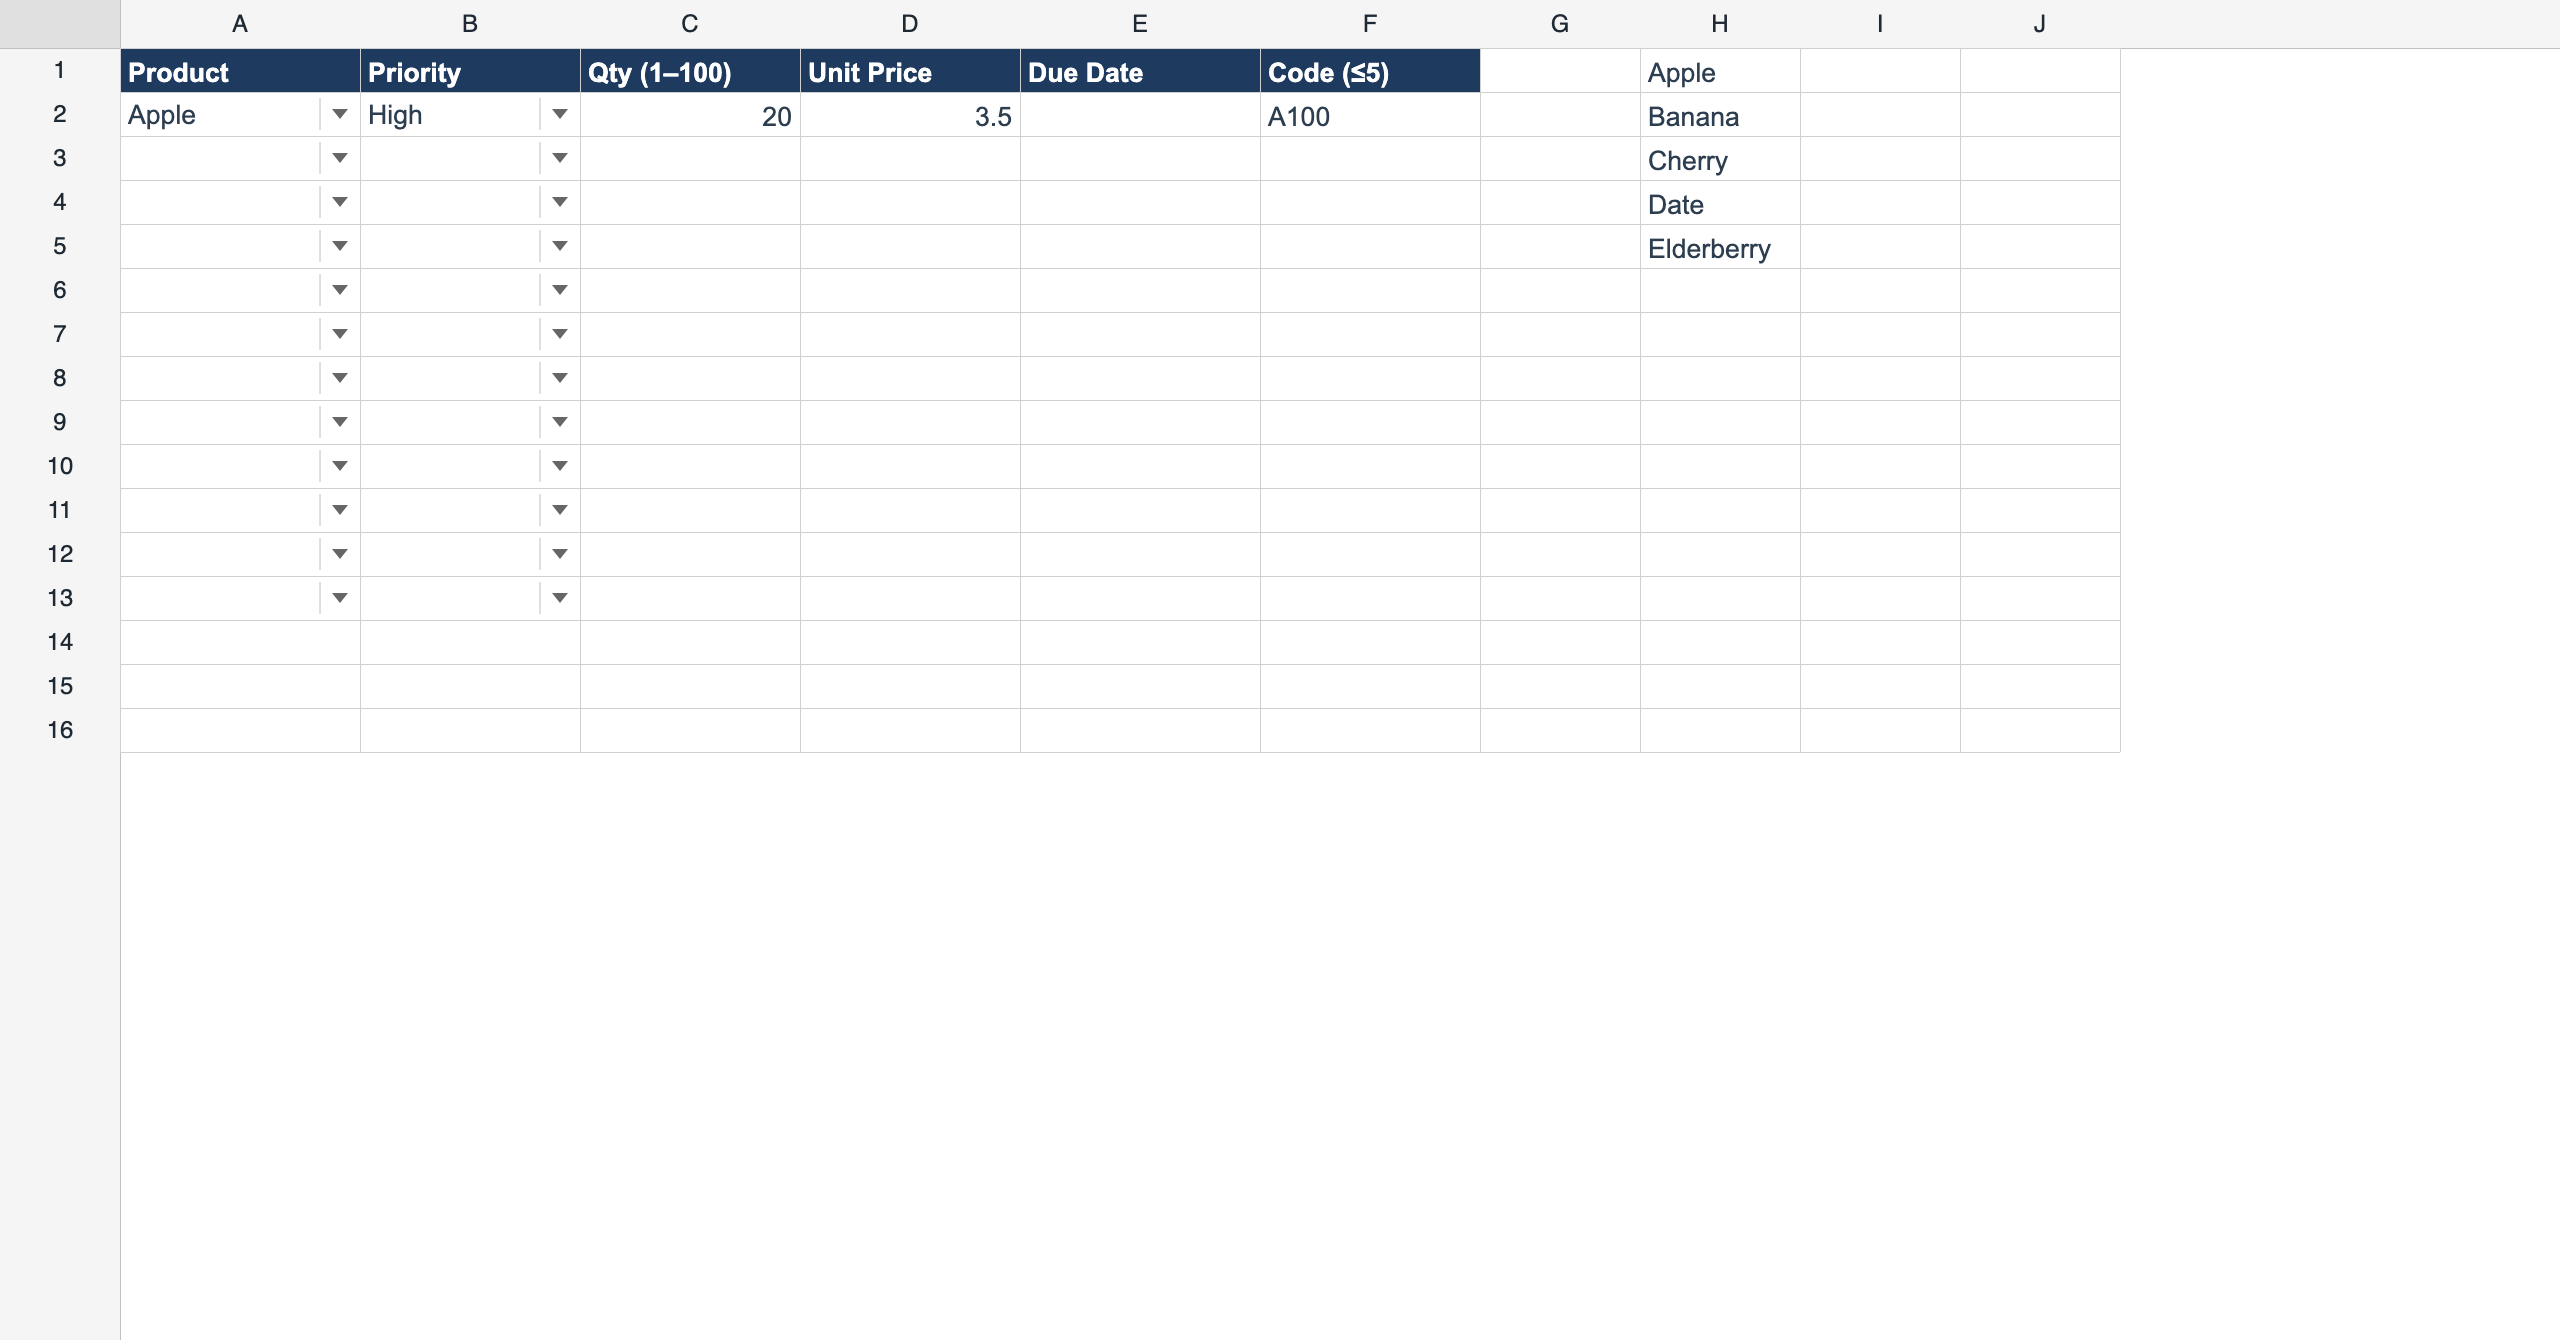
Data Validation
PROExcel-style input rules (入力規則): list dropdowns, whole/decimal/date/time and text-length bounds, and custom formulas — with stop / warning / information alerts. Pro-authored rules also enforce in Lite and round-trip through xlsx.
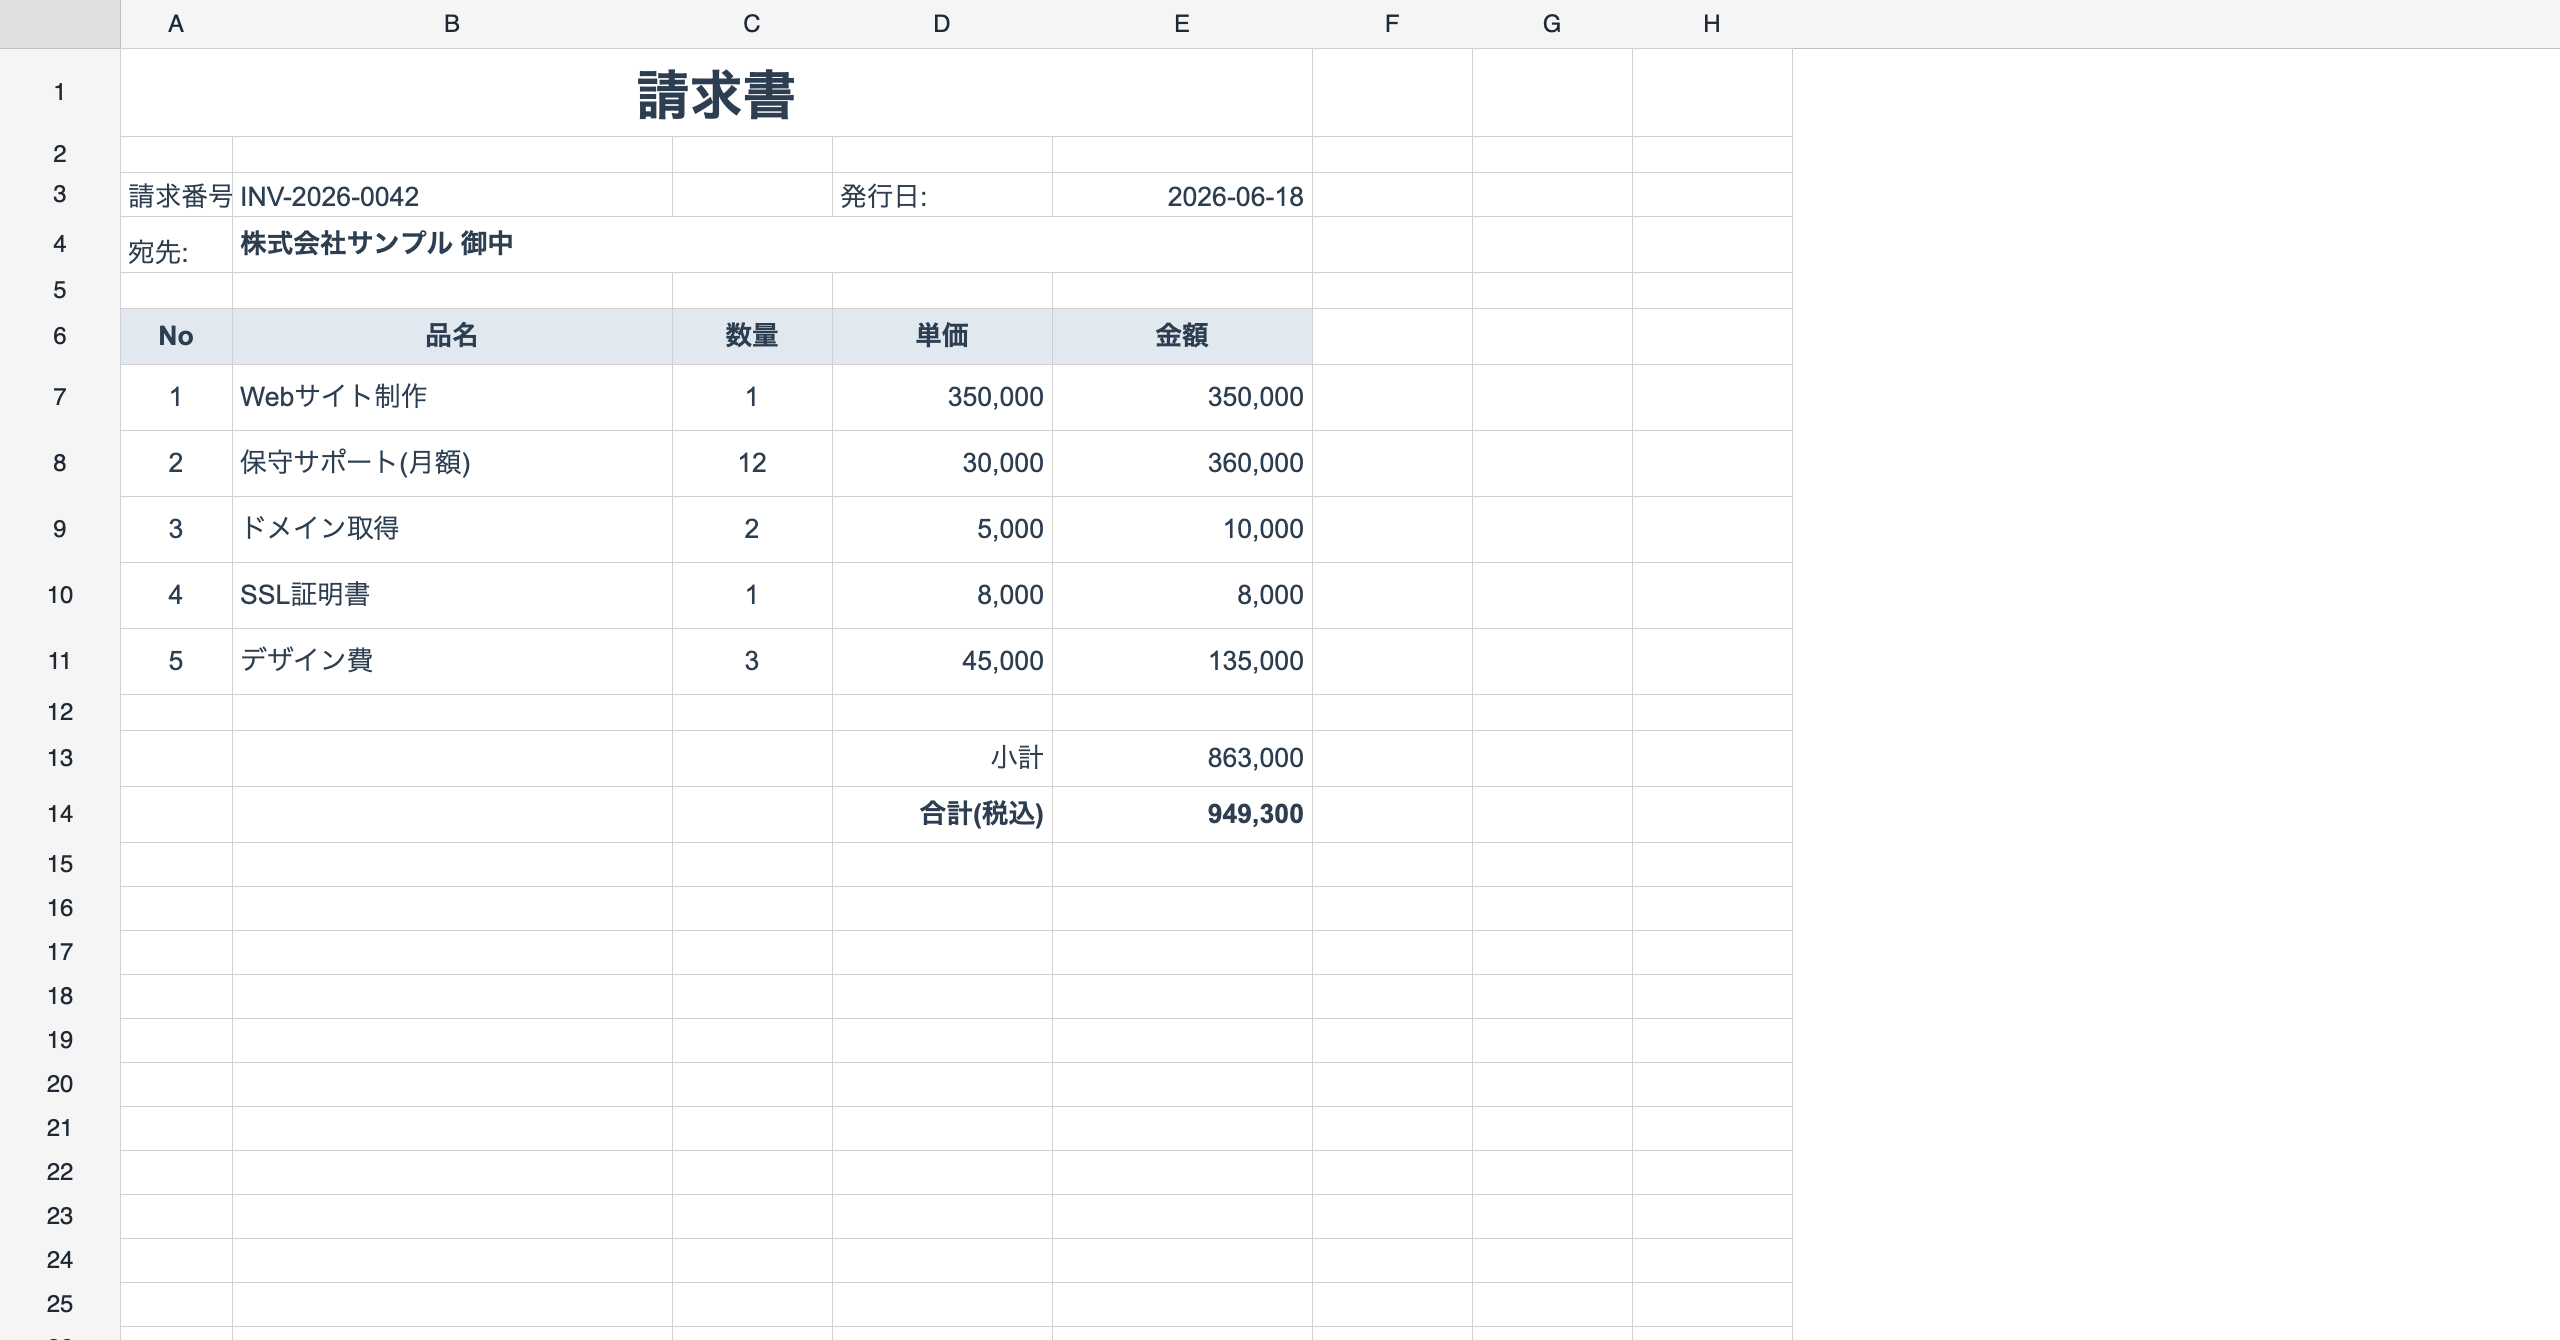
Report Binding
PROTemplate-driven detail repetition (テンプレート明細繰り返し): design an invoice once with {{token}} cells, then bindReport(data) materializes header / detail(×N) / footer in place with per-row formula shift, footer aggregates, and page breaks.
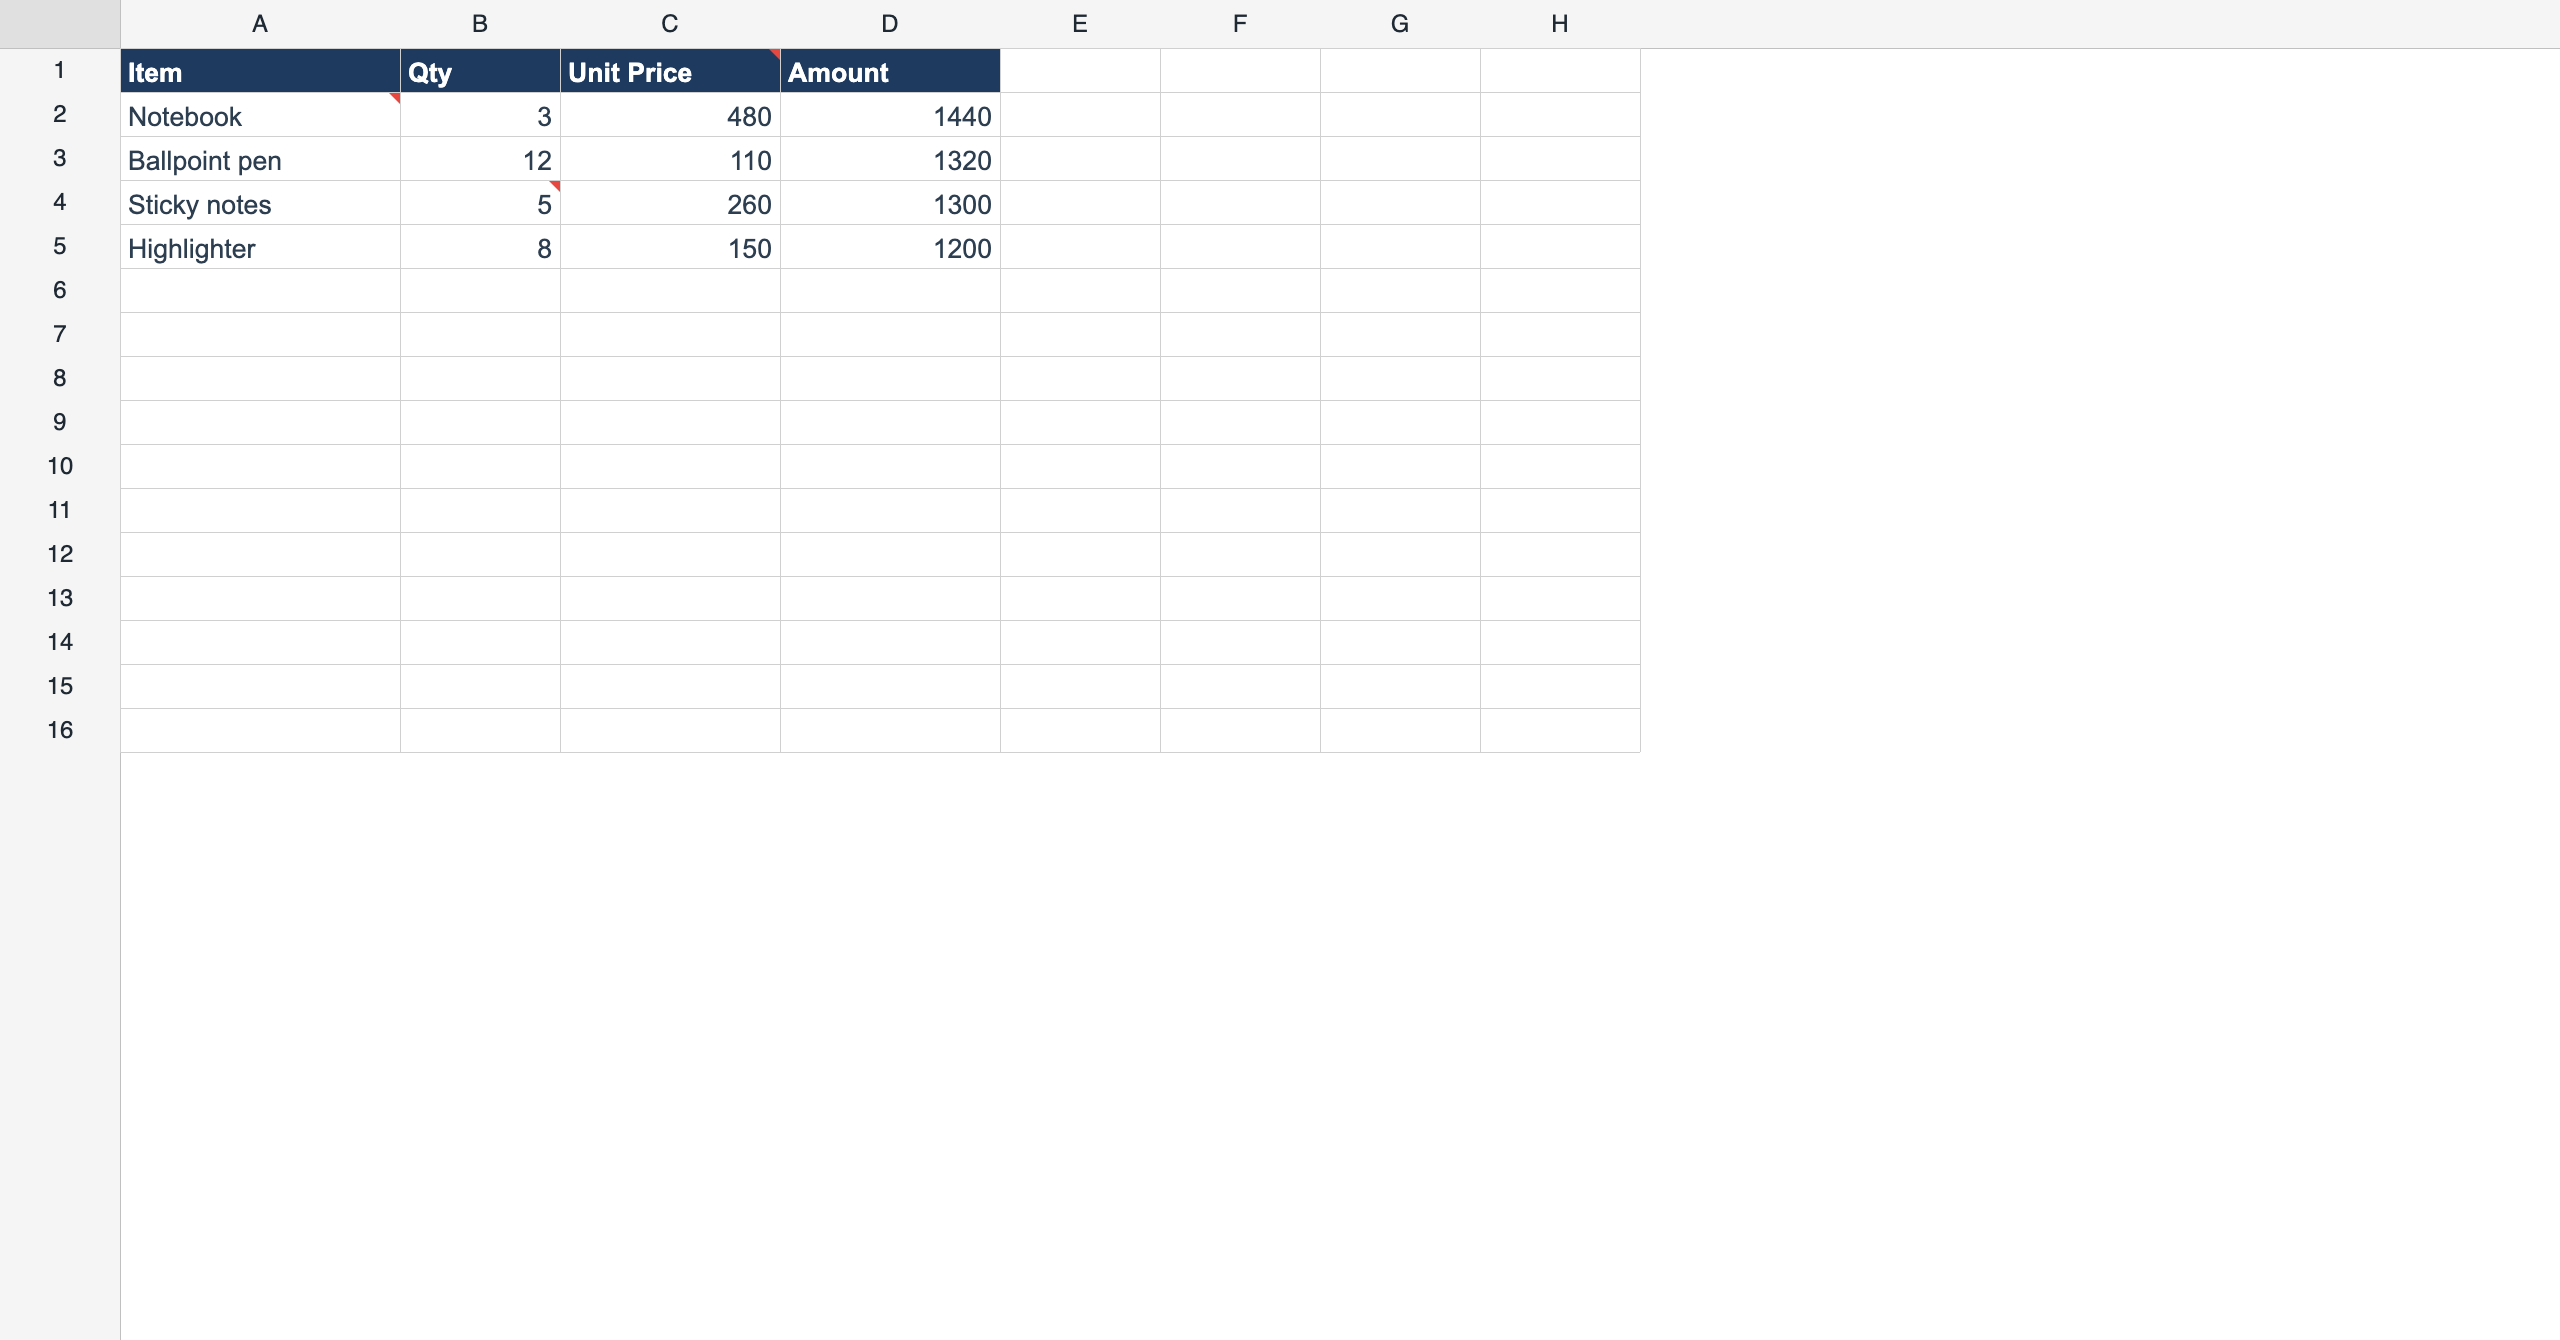
Cell Comments
PROClassic Excel comments / memos (メモ) — one per cell, shown with a red corner marker and a hover bubble. Select a cell to add, edit, or remove its comment. xlsx read, JSON round-trip.
PDF & Page Layout
PRODependency-free PDF export with a page-break preview: setShowPageBreaks(true) shows the printable pages on screen, and saveAsPdf({ font, usePageBreaks: true }) paginates the PDF exactly like the preview — with the bundled Japanese font.
📋 Real-World Examples (4)
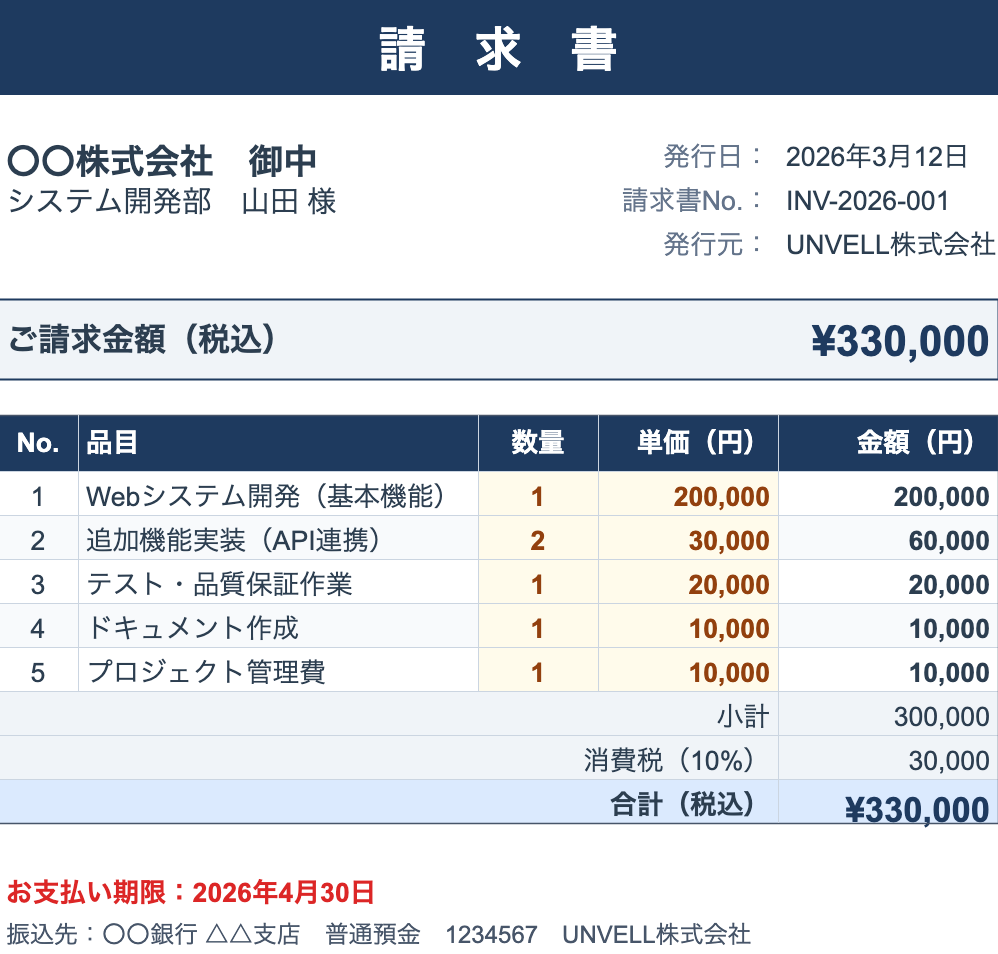
Invoice (Formula)
PROInvoice with editable quantities and unit prices — totals auto-calculate with formulas. Available on StackBlitz as React, Vue, and Vanilla.
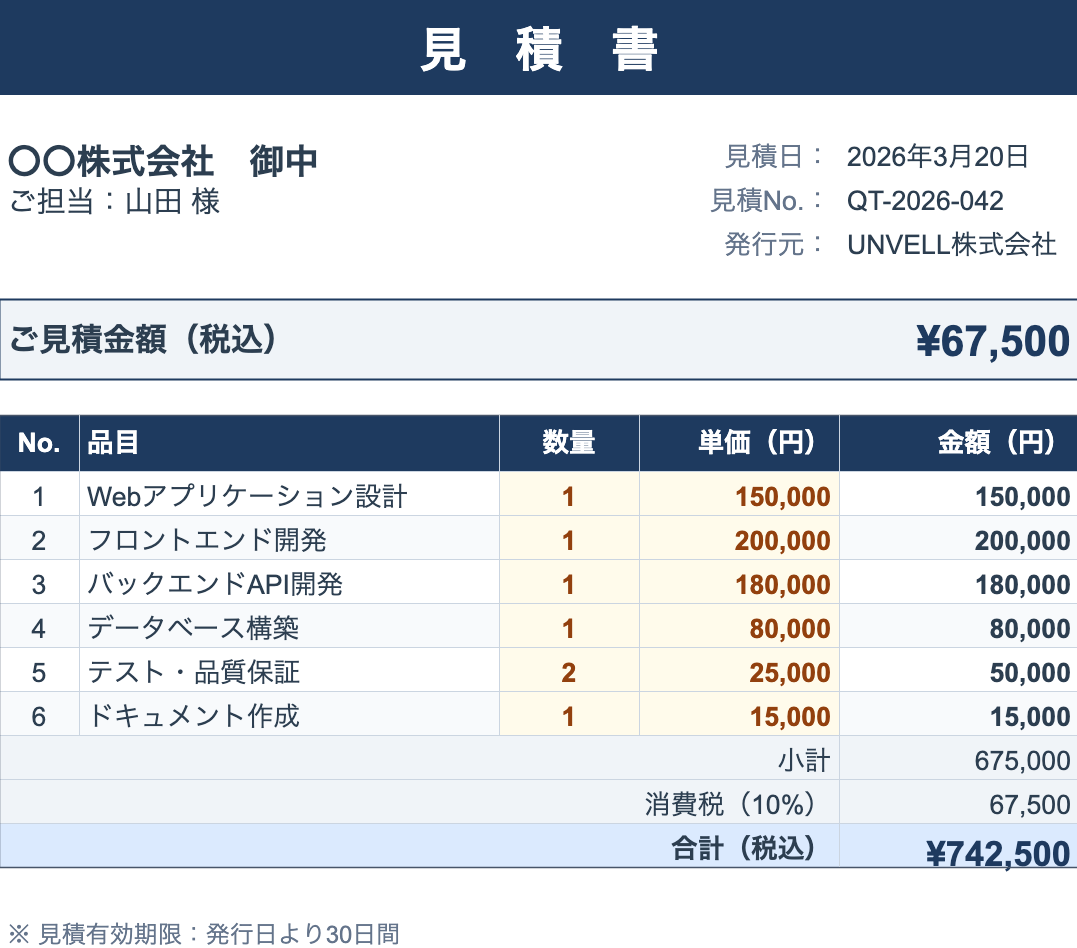
Interactive Quotation
PROEdit quantities and unit prices — totals auto-calculate with SUM formulas. Real spreadsheet formulas running in the browser.
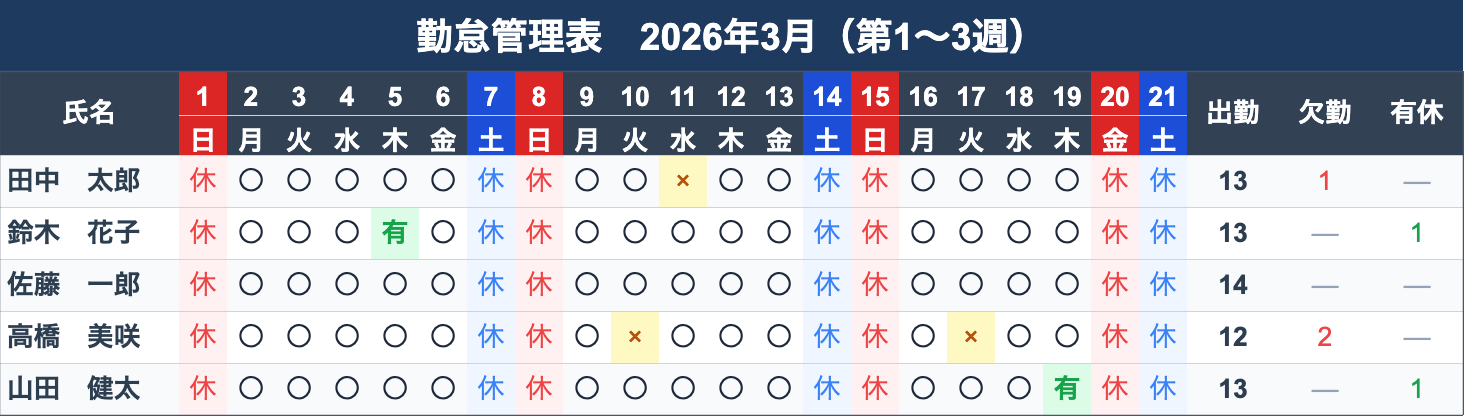
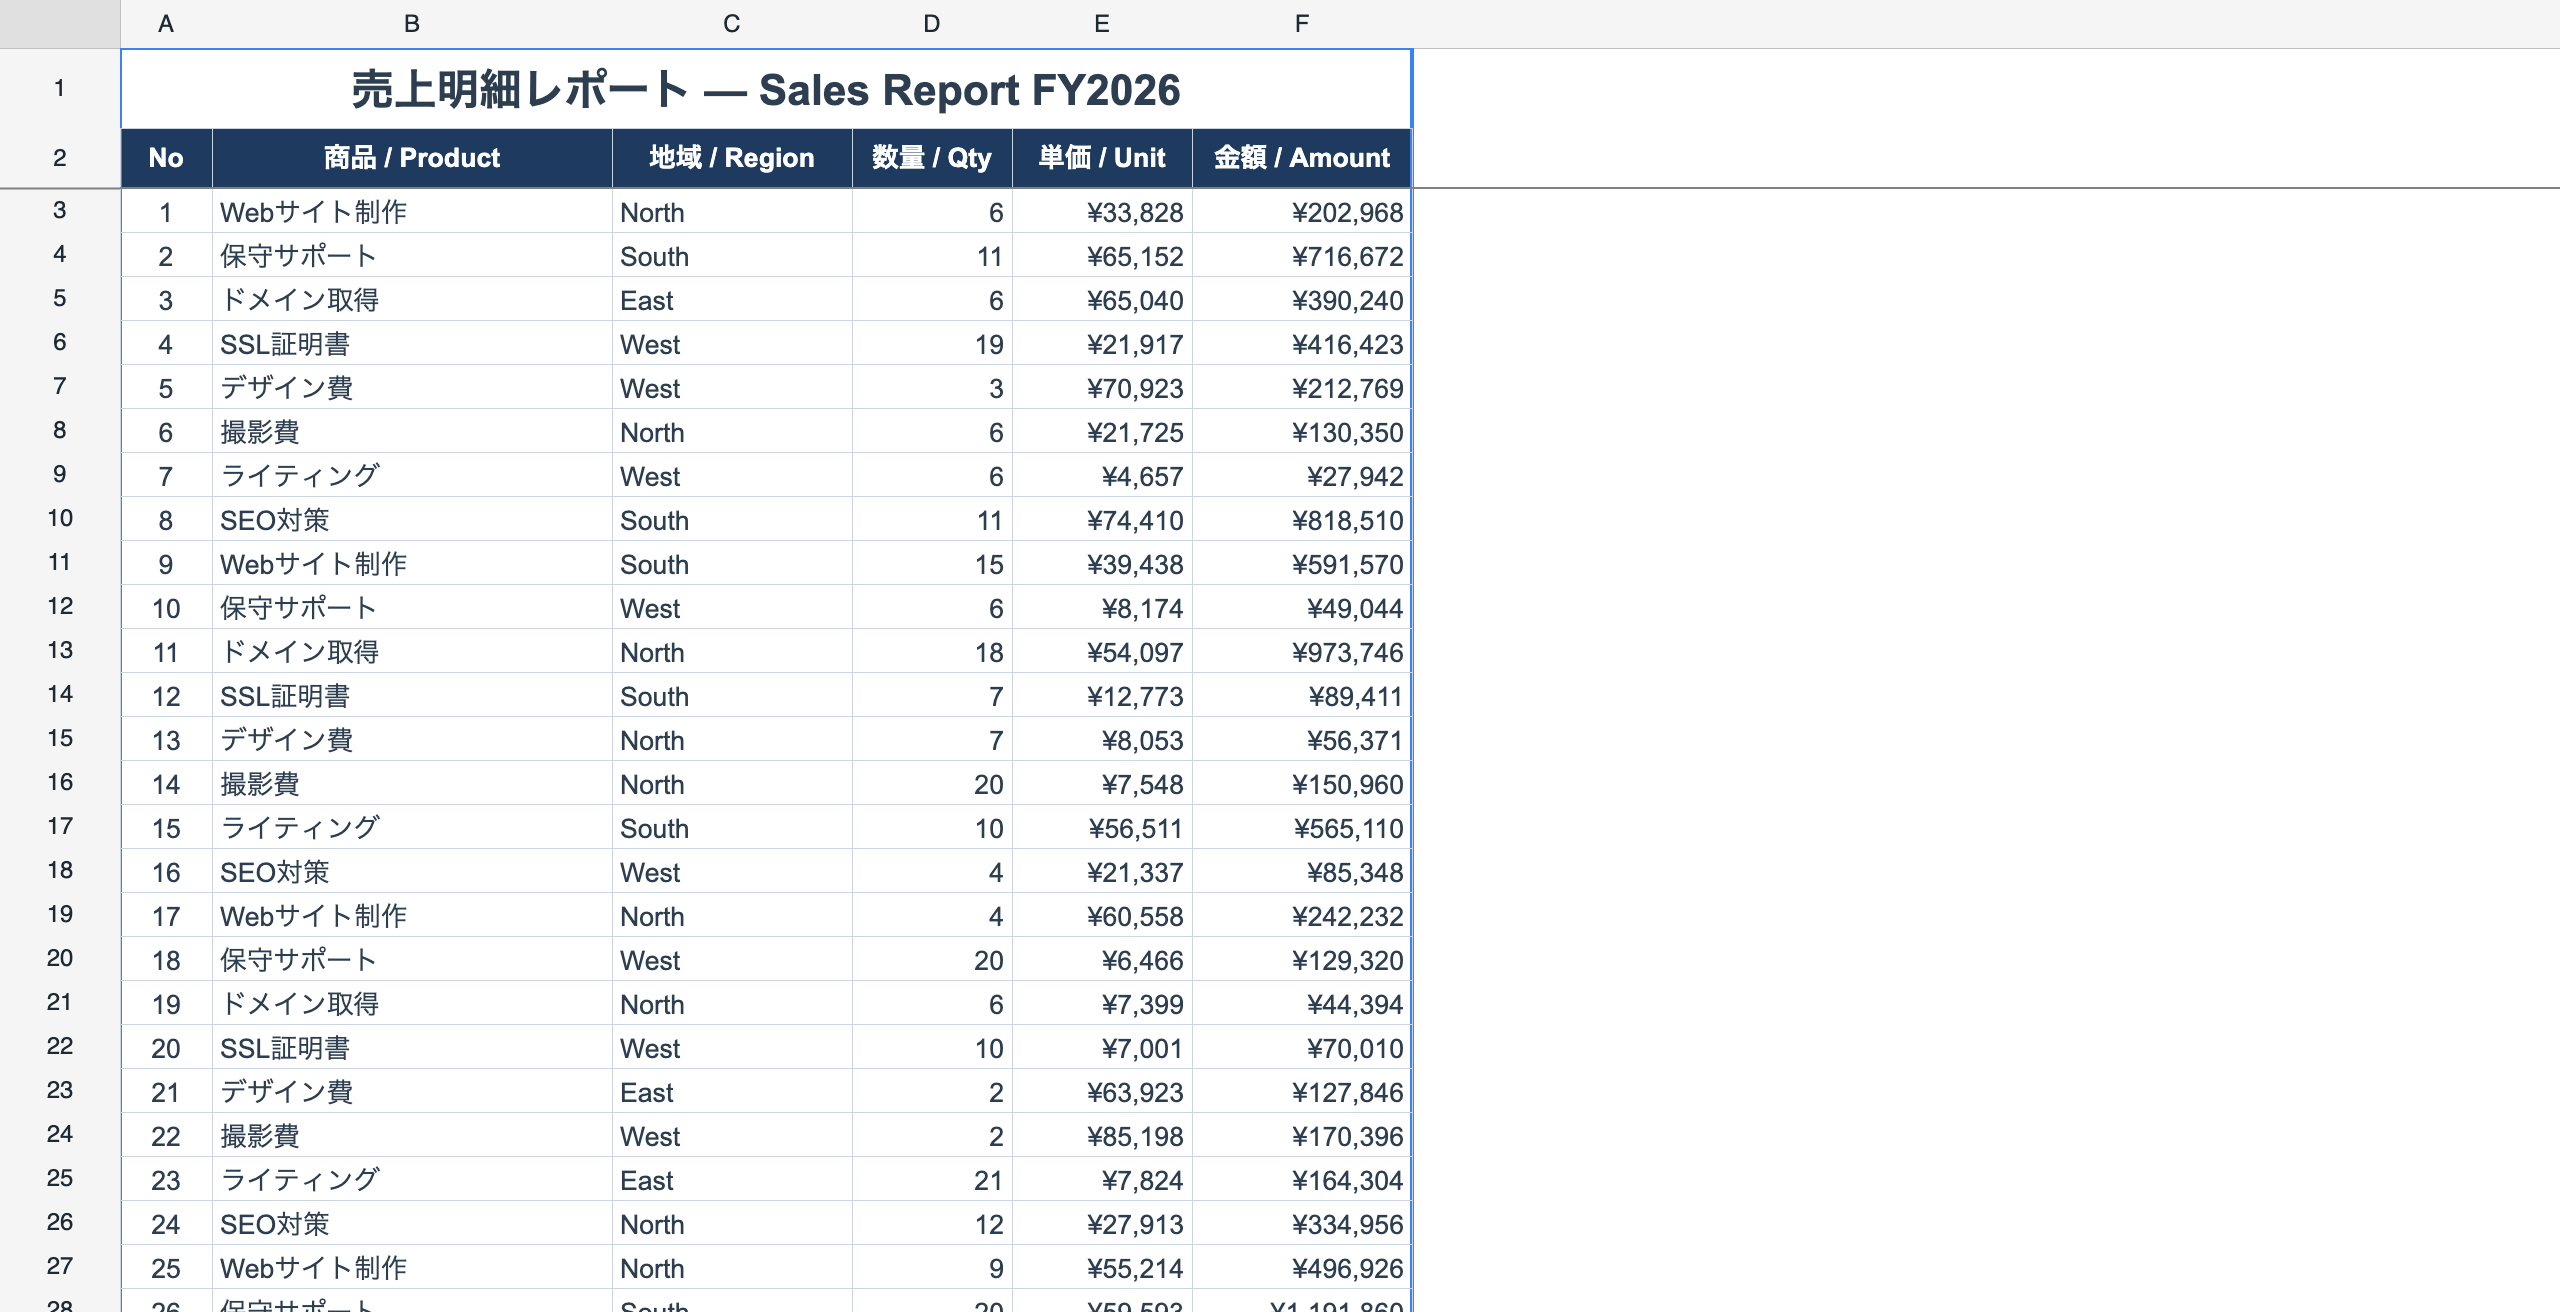
Attendance Sheet
Monthly attendance tracking with weekend/holiday coloring and summary columns.
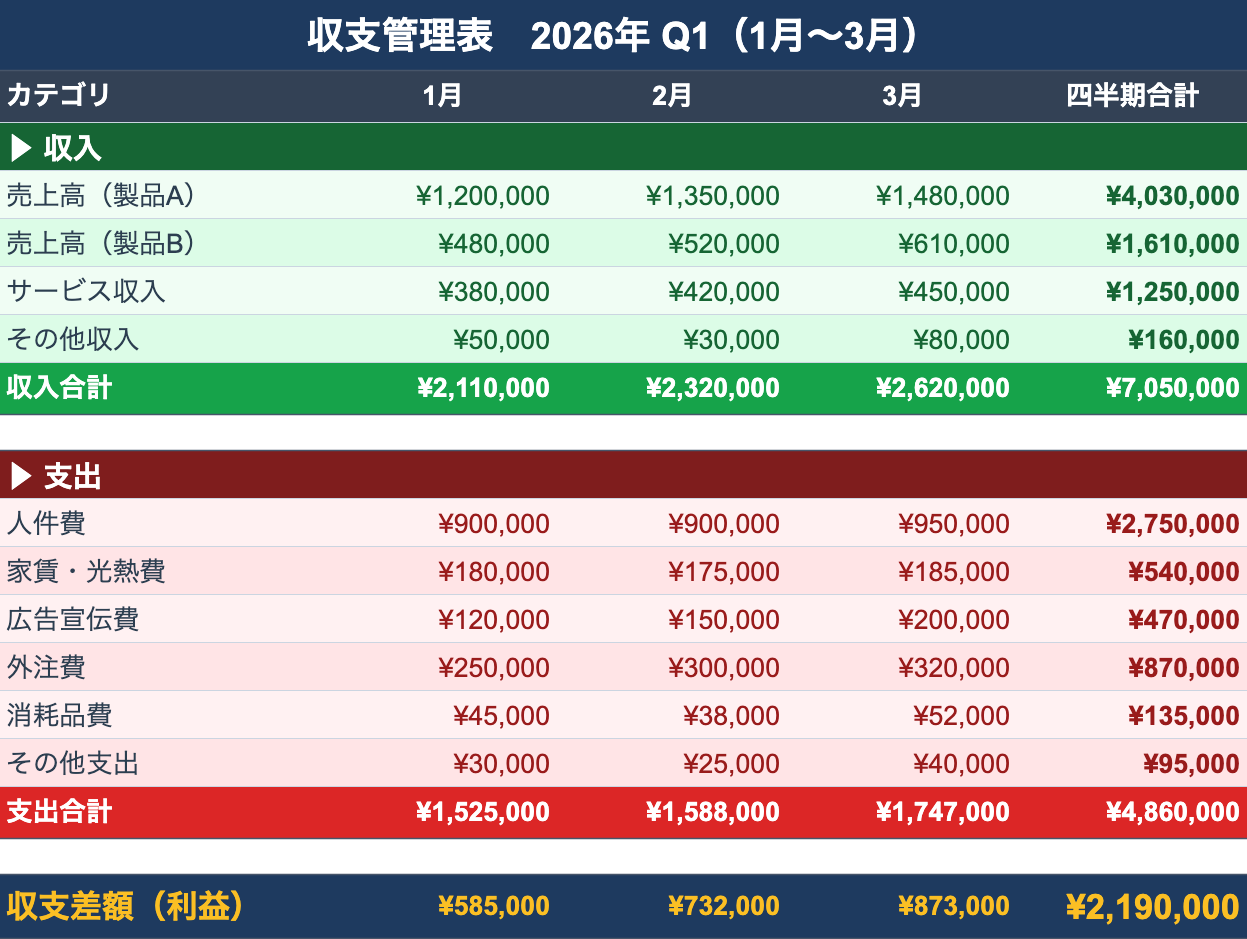
Budget Tracker
Quarterly income and expense tracker with category sections, color-coded totals, and profit summary.
⚡ Performance (3)
1,000,000 Rows — Delay Load
PROA scrollbar that represents one million rows while only visible rows are fetched on demand. Jump anywhere — the grid keeps a few hundred rows in memory.
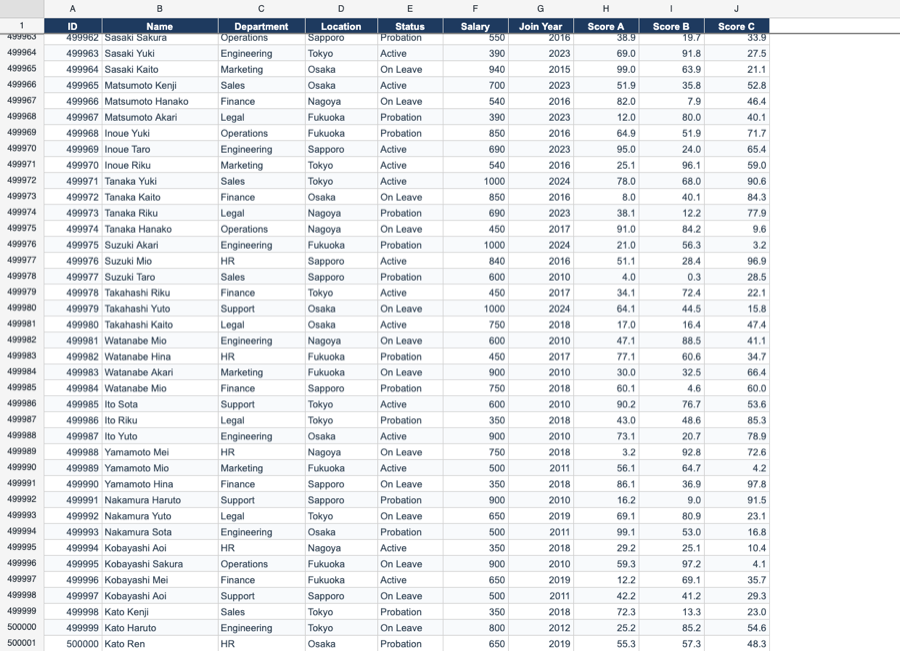
Big Data — 10,000 Rows
PROLoad 10,000 rows instantly and sort by any column. Sort time is displayed in real-time — typically under 1 second.
Animation
PROFormula results animate smoothly when values change. Watch numbers and progress bars transition fluidly.
🔄 Data I/O (1)
XLSX → JSON Converter
Load an .xlsx and convert it to JSON in the browser — clean data rows for apps & AI, or the lossless ReoGrid JSON workbook. Toggle, copy, download.
Want to see some magic?
Drop your own .xlsx file and watch it render instantly. No upload, no server — everything stays on your machine.
Powered by ReoGrid Pro — supports styles, merged cells, images, and more.