
Pivot Tables
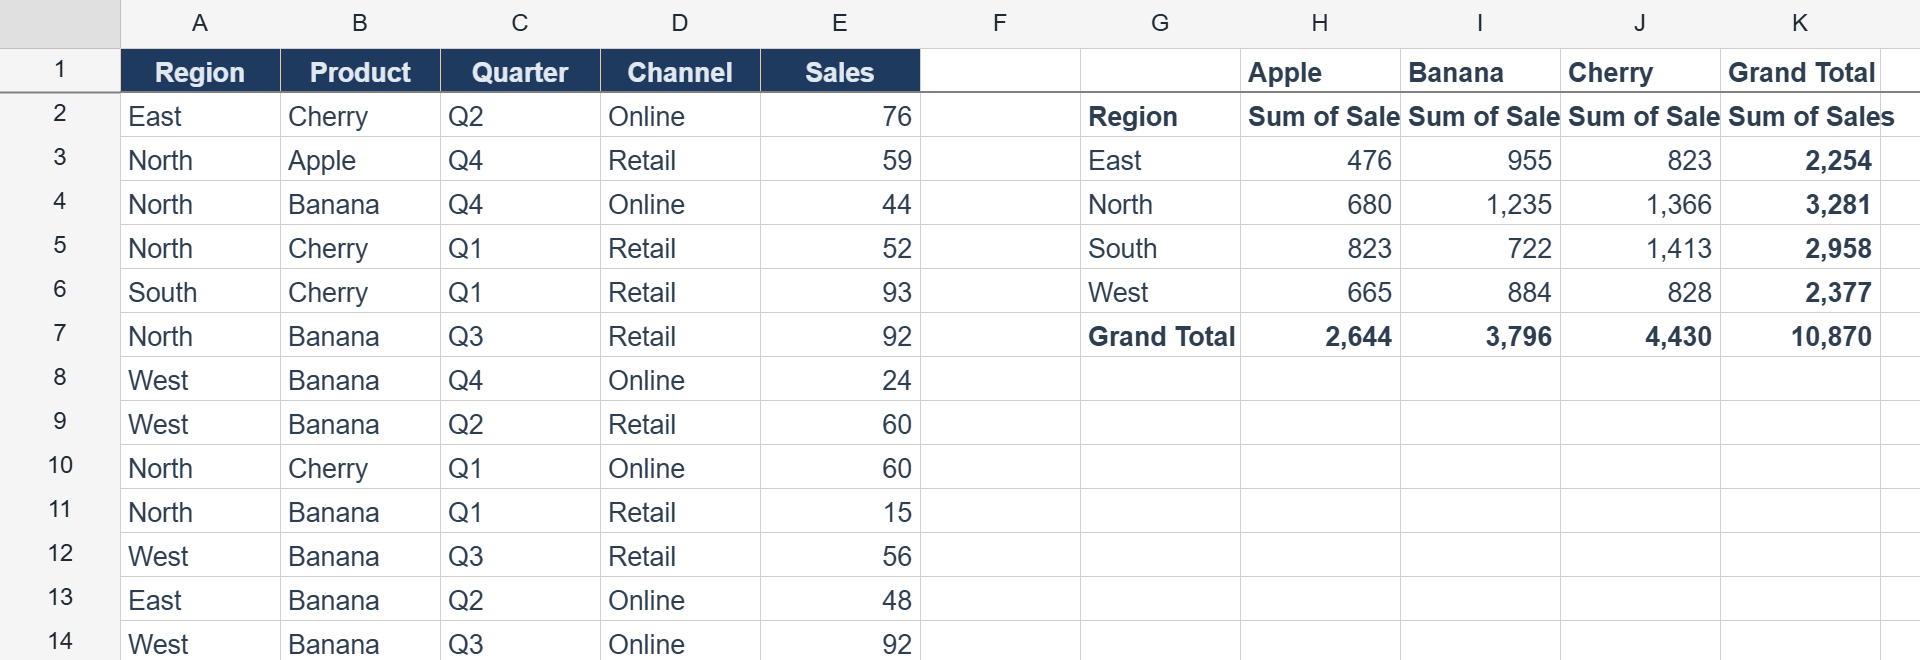
Since v1.4.0 a worksheet can render a pivot table — a cross-tab summary of a source range, aggregated by row and column fields, written as a live block that recomputes when the underlying data changes.
Note: Pivot Tables are available in the Pro edition.
Creating a pivot
Point a PivotDefinition at a source range (its first row holds the field headers), choose an anchor cell for the output, and pick your row/column/value fields:
import { createReogrid } from '@reogrid/pro'

const grid = createReogrid({ workspace: '#app' })
const ws = grid.worksheet

// Source data lives in A1:E201 (row 0 = headers: Region, Product, Quarter, Channel, Sales)
const pivot = ws.createPivot({
  source: { row: 0, col: 0, rows: 201, columns: 5 },
  anchor: { row: 0, column: 6 },          // render the block starting at G1
  rows:    [{ field: 'Region' }],
  columns: [{ field: 'Product' }],
  values:  [{ field: 'Sales', agg: 'sum', numberFormat: '#,##0' }],
})

console.log(pivot.id)      // stable id
console.log(pivot.bounds)  // RangePosition the output currently occupies
createPivot returns a PivotHandle. The output cells are locked; grand-total row and column are added by default.
PivotDefinition
| Field | Type | Default | Description |
|---|---|---|---|
source | RangePosition | — | Source range; source.row is the header row. |
anchor | { row, column } | — | Top-left cell of the rendered output block. |
rows | { field: string }[] | [] | Row-axis fields (by header name). |
columns | { field: string }[] | [] | Column-axis fields. |
values | { field, agg, caption?, numberFormat? }[] | — | Measure fields — what gets aggregated. |
filters | { field, include?: string[] }[] | — | Keep only records whose field is in include. |
layout | 'tabular' | 'tabular' | Output layout (only 'tabular' in v1). |
showRowGrandTotals | boolean | true | Right-side grand-total column. |
showColumnGrandTotals | boolean | true | Bottom grand-total row. |
id | string | auto | Stable id (auto-assigned when omitted). |
Aggregation types
agg on each value field is one of:
'sum' · 'count' · 'countNumbers' · 'average' · 'max' · 'min' · 'product'
values: [
  { field: 'Sales', agg: 'sum',     caption: 'Total sales', numberFormat: '#,##0' },
  { field: 'Sales', agg: 'average', caption: 'Avg sale',    numberFormat: '#,##0.0' },
]
Filters
Restrict which source records feed the pivot:
ws.createPivot({
  source: { row: 0, col: 0, rows: 201, columns: 5 },
  anchor: { row: 0, column: 6 },
  rows:    [{ field: 'Region' }],
  values:  [{ field: 'Sales', agg: 'sum' }],
  filters: [{ field: 'Channel', include: ['Online'] }], // Online records only
})
Working with the handle
PivotHandle is a thin, stateless handle that delegates back to the worksheet:
pivot.update({ columns: [{ field: 'Quarter' }] }) // merge changes + recompute
pivot.refresh()                                    // force a recompute from source
pivot.definition                                   // current resolved definition
pivot.bounds                                       // output rectangle, or null
pivot.remove()                                     // clear the block + drop the pivot
Equivalent methods exist on the worksheet by id: ws.getPivot(id), ws.getPivots(), ws.getPivotBounds(id), ws.updatePivot(id, partial), ws.refreshPivot(id), ws.removePivot(id).
Known limitation: refresh after structural edits
A pivot stores its source and anchor as fixed ranges. Inserting or deleting rows/columns does not shift those stored ranges, so after a structural edit the pivot can read the wrong cells. Call refreshPivot (or pivot.refresh()) after any insert/delete to re-read the source:
ws.insertRows(5, 3)      // structural edit
ws.refreshPivot(pivot.id) // re-read source and re-render
Editing a value inside the existing source range recomputes the pivot live — only structural inserts/deletes need the manual refresh.
Related
- Table Styles — format the source range as a banded Excel table.
- Sort & Filter — filter and sort the source data in place.
- Number Formatting — the
numberFormatcodes used on value fields.
Sorry to hear that. What could be improved?