
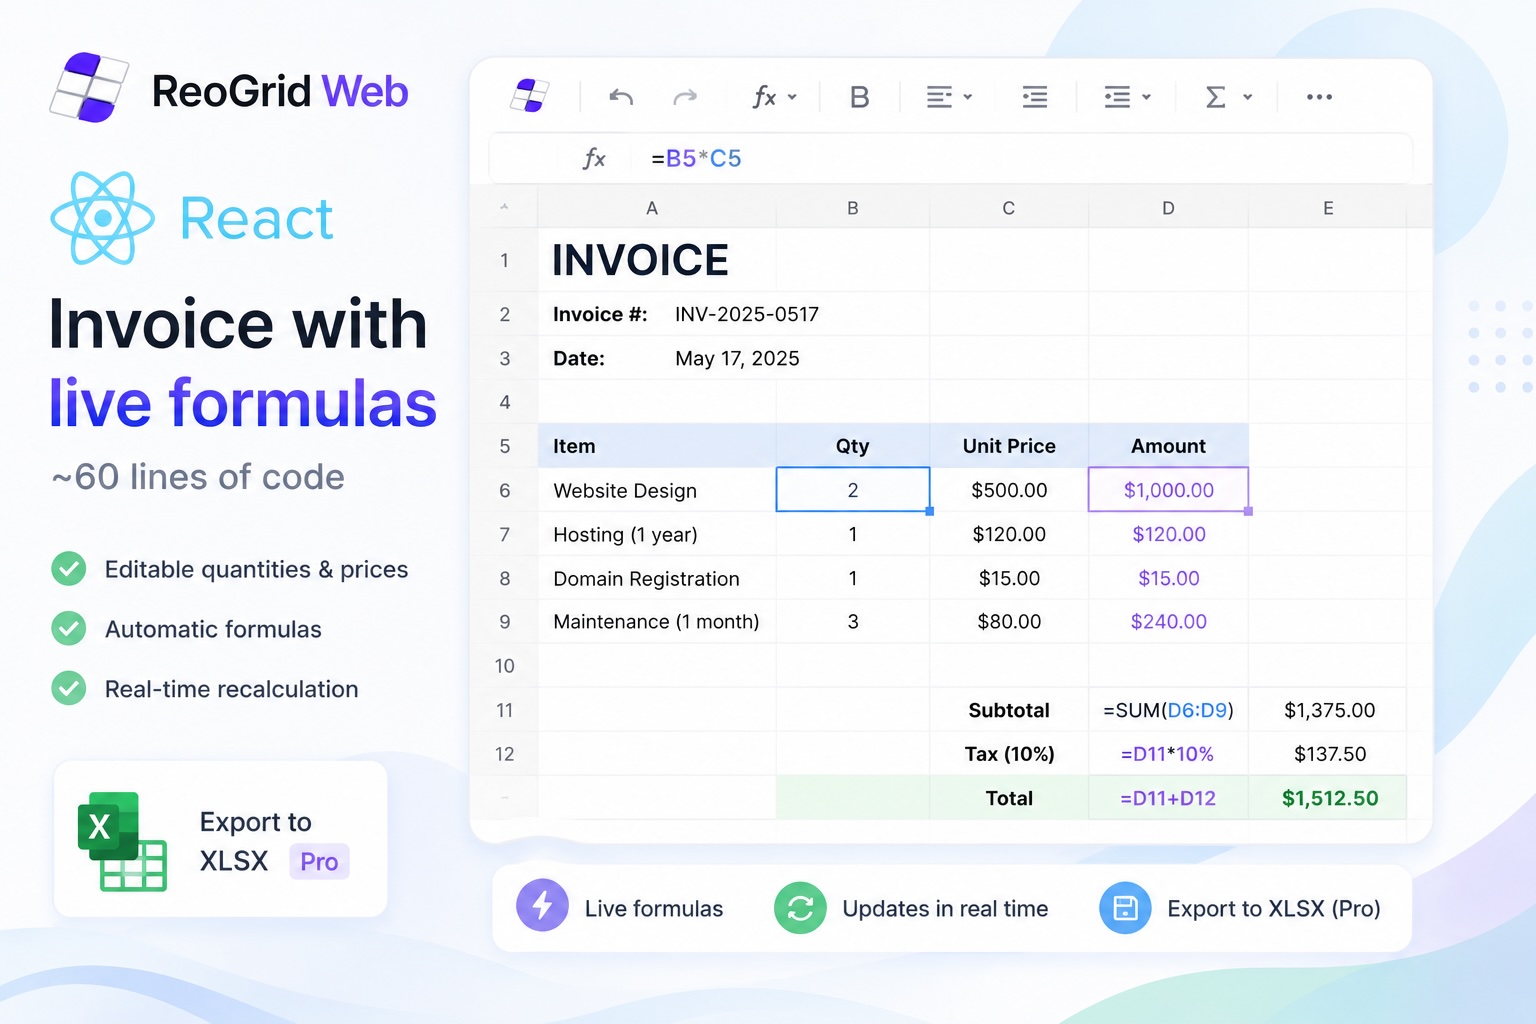
The “invoice” is the canonical small spreadsheet use case: a header, line items with quantity × price, a subtotal, tax, total. The kind of thing you used to build with a <table> plus a chunk of useEffect doing the arithmetic, and a separate “download as Excel” button that produced a barely-formatted CSV.
Here is the same thing in a real spreadsheet — editable, formula-backed, and one method call away from a downloadable .xlsx — inside a React component:
import { Reogrid, type ReogridInstance } from '@reogrid/pro/react';

const items: Array<[string, number, number]> = [
  ['Web system development (core)', 1, 200_000],
  ['Add-on: API integration',       2,  30_000],
  ['Testing & QA',                  1,  20_000],
  ['Documentation',                 1,  10_000],
  ['Project management',            1,  10_000],
];

export default function Invoice() {
  return (
    <Reogrid
      style={{ width: '100%', height: 700 }}
      options={{ animation: true, licenseKey: 'YOUR-LICENSE-KEY' }}
      onReady={({ worksheet: ws }) => {
        ws.setGridSize(25, 5);

        ws.showGridLines = false;

        // Column widths — the item column needs room for its text
        [52, 260, 72, 110, 120].forEach((w, c) => { ws.column(c).width = w; });
        // Title bar
        ws.range('A1:E1').merge().setValue('INVOICE')
          .setStyle({ fontSize: 18, bold: true, textAlign: 'center', backgroundColor: '#1e3a5f', color: '#ffffff' });
        ws.row(0).height = 48;

        // Meta
        ws.cell('A3').setValue('Bill to:').setStyle({ bold: true });
        ws.cell('B3').setValue('Acme Corp., Yamada-san');
        ws.cell('D3').setValue('Date:').setStyle({ textAlign: 'right', color: '#64748b' });
        ws.cell('E3').setValue('2026-05-17');
        ws.cell('D4').setValue('Invoice #:').setStyle({ textAlign: 'right', color: '#64748b' });
        ws.cell('E4').setValue('INV-2026-001');

        // Table header
        const hdr = { bold: true, backgroundColor: '#1e3a5f', color: '#ffffff' };
        ws.cell('A7').setValue('No.').setStyle({ ...hdr, textAlign: 'center' });
        ws.cell('B7').setValue('Item').setStyle(hdr);
        ws.cell('C7').setValue('Qty').setStyle({ ...hdr, textAlign: 'center' });
        ws.cell('D7').setValue('Unit price').setStyle({ ...hdr, textAlign: 'right' });
        ws.cell('E7').setValue('Amount').setStyle({ ...hdr, textAlign: 'right' });

        // Line items — qty and unit price are editable; amount is a formula
        items.forEach(([name, qty, price], i) => {
          const row = 8 + i;                       // 1-based A1 row
          const editable = { backgroundColor: '#fffbeb', color: '#92400e', bold: true };

          ws.cell(`A${row}`).setValue(String(i + 1)).setStyle({ textAlign: 'center' });
          ws.cell(`B${row}`).setValue(name);
          ws.setCellInput(row - 1, 2, String(qty));          ws.setCellStyle(row - 1, 2, { ...editable, textAlign: 'center' });
          ws.setCellInput(row - 1, 3, String(price));        ws.setCellStyle(row - 1, 3, { ...editable, textAlign: 'right' });
          ws.setCellNumberFormat(row - 1, 3, '#,##0');
          ws.setCellInput(row - 1, 4, `=C${row}*D${row}`);   // amount formula
          ws.setCellNumberFormat(row - 1, 4, '#,##0');
        });

        const lastItemRow = 8 + items.length - 1;
        const sumRow = lastItemRow + 1, taxRow = sumRow + 1, totalRow = taxRow + 1;

        // Subtotal / tax / total — all formulas
        ws.range(`A${sumRow}:D${sumRow}`).merge();
        ws.cell(`A${sumRow}`).setValue('Subtotal').setStyle({ textAlign: 'right', backgroundColor: '#f0f4f8' });
        ws.setCellInput(sumRow - 1, 4, `=SUM(E8:E${lastItemRow})`);
        ws.setCellNumberFormat(sumRow - 1, 4, '#,##0');

        ws.range(`A${taxRow}:D${taxRow}`).merge();
        ws.cell(`A${taxRow}`).setValue('Tax (10%)').setStyle({ textAlign: 'right', backgroundColor: '#f0f4f8' });
        ws.setCellInput(taxRow - 1, 4, `=E${sumRow}*0.1`);
        ws.setCellNumberFormat(taxRow - 1, 4, '#,##0');

        ws.range(`A${totalRow}:D${totalRow}`).merge();
        ws.cell(`A${totalRow}`).setValue('Total (incl. tax)').setStyle({ bold: true, textAlign: 'right', backgroundColor: '#dbeafe' });
        ws.setCellInput(totalRow - 1, 4, `=E${sumRow}+E${taxRow}`);
        ws.setCellNumberFormat(totalRow - 1, 4, '¥#,##0');
        ws.setCellStyle(totalRow - 1, 4, { bold: true, textAlign: 'right', backgroundColor: '#dbeafe', color: '#1e3a5f', fontSize: 13 });

        // Borders on the table
        ws.range(`A7:E${totalRow}`).border({ style: 'solid', color: '#475569', width: 1.5 });
      }}
    />
  );
}
That is the entire component. The user can click any qty or unit-price cell, type a new number, hit Enter, and watch the amount, subtotal, tax, and total recalculate immediately.
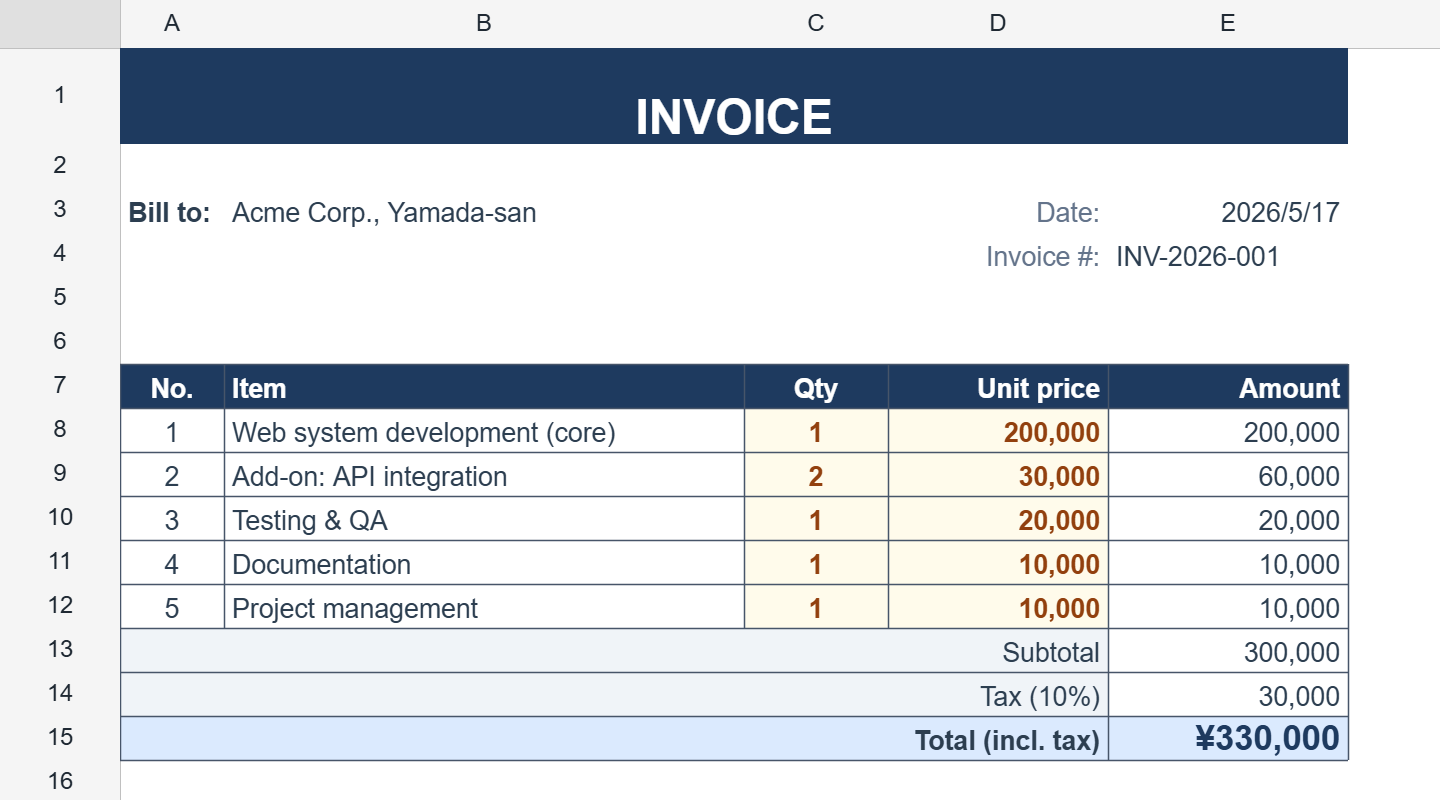
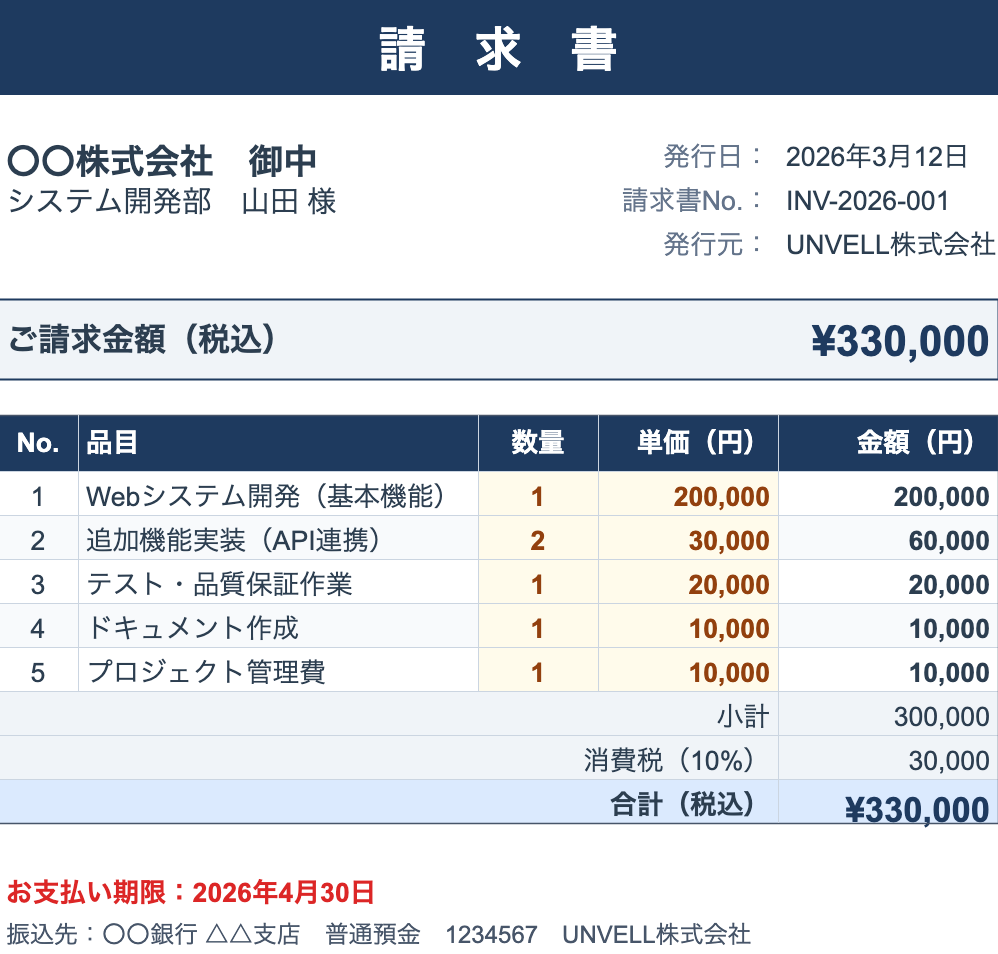
The Invoice demo on this site is essentially this code — try it live.
The three things that make this work
1. setCellInput vs setValue
This is the single most common question. Both go through the same code path as a user typing into the cell, so a string starting with = becomes a live formula either way:
worksheet.cell('A1').setValue('Hello');   // string "Hello"
worksheet.cell('B1').setValue(42);        // number 42
worksheet.cell('C1').setValue('=A1+B1');  // ← live formula, evaluated on every dependency change
The real difference is how you address the cell: cell('C1').setValue(...) is the A1-handle form, while setCellInput(row, col, ...) takes 0-based coordinates — convenient inside loops like the line items above:
worksheet.setCellInput(0, 2, '=A1+B1'); // same formula, 0-based row/columnWhen reading back, cell('C1').value returns the raw input — for a formula cell that is the formula text ('=A1+B1'), not the computed result. To read computed results, use worksheet.getDisplayText(row, col) for the formatted text or worksheet.getCellNumericValue(row, col) for the number.
2. Number formats are Excel-compatible
setCellNumberFormat(row, col, '#,##0') accepts the same format pattern syntax as Excel. A few useful ones for invoices:
| Pattern | Renders | Notes |
|---|---|---|
#,##0 | 200,000 | Thousands separator, no decimals |
#,##0.00 | 200,000.00 | Two decimals |
¥#,##0 | ¥200,000 | Currency prefix |
$#,##0.00 | $1,250.00 | Dollar |
0.00% | 12.50% | Percentage |
yyyy-mm-dd | 2026-05-17 | ISO date |
#,##0;[Red]-#,##0 | red negatives | Conditional color section |
See the number formatting doc for the full grammar including conditional sections and Japanese era formats.
3. The grid is the source of truth — React subscribes
ReoGrid Web is an imperative canvas component. The right pattern is “the grid owns the data, React subscribes,” not “React state owns the data, the grid renders it.” If you want a summary widget in React that reacts to the user editing the invoice, hook into onCellValueChange:
const [total, setTotal] = useState(0);
const gridRef = useRef<ReogridInstance>(null);

<Reogrid
  ref={gridRef}
  style={{ width: '100%', height: 700 }}
  onReady={({ worksheet }) => { /* setup as above */ }}
  onCellValueChange={() => {
    // Read the recomputed total cell after any edit — E15 is (14, 4) in 0-based coords
    const t = gridRef.current?.worksheet.getCellNumericValue(14, 4);
    setTotal(t || 0);
  }}
/>

<div>Total: <strong>¥{total.toLocaleString()}</strong></div>
Do not try to make every cell a React-controlled prop — you would defeat the canvas renderer’s whole reason for existing. The grid is the source of truth for cell data; React state holds derived/summary values.
For a deeper treatment of this pattern, see the Sync Grid with React State recipe.
Adding a “Download as xlsx” button
Pro-tier only, but trivial — saveAsXlsx() builds the file and triggers the browser download in one call:
<button onClick={() => {
  gridRef.current!.worksheet.saveAsXlsx({ filename: 'invoice.xlsx' });
}}>
  Download as xlsx
</button>
Both options are optional: filename defaults to reogrid.xlsx, and sheetName defaults to Sheet1. If you need the raw bytes (for example, to upload the file instead of downloading it), use the lower-level buildXlsxFromSnapshot() re-exported from the package root.
The exported file preserves the merged header, the column widths, all styles, all formulas (Excel re-evaluates them — they are not frozen values), the number formats, and the borders. Open it in Excel; everything that was in the grid is there.
Where to go next
- Add a logo image: images embedded in an imported
.xlsxare displayed automatically — design the logo into your template file. - Conditional formatting: highlight overdue line items in red. See Conditional Formatting.
- Save and restore as JSON: use
writeReoGridJson/readReoGridJsonfor lossless round-trips through your backend without going through xlsx. - Vue version: the same logic works with
<Reogrid>from@reogrid/pro/vue— droponReadyfor@ready.
The companion Build an Invoice recipe covers a Lite-edition version (no SUM, but arithmetic line totals work) for the free tier.
Tomorrow’s article (last in this launch series): how ReoGrid Web compares to AG Grid and Handsontable, and which one is the right fit for which use case.
▶ Run it locally: the code in this article is a ready-to-run React project in unvell/web-spreadsheet-reogrid-samples — git clone, npm install && npm run dev, then open the Invoice sample. Browse all live demos too.