
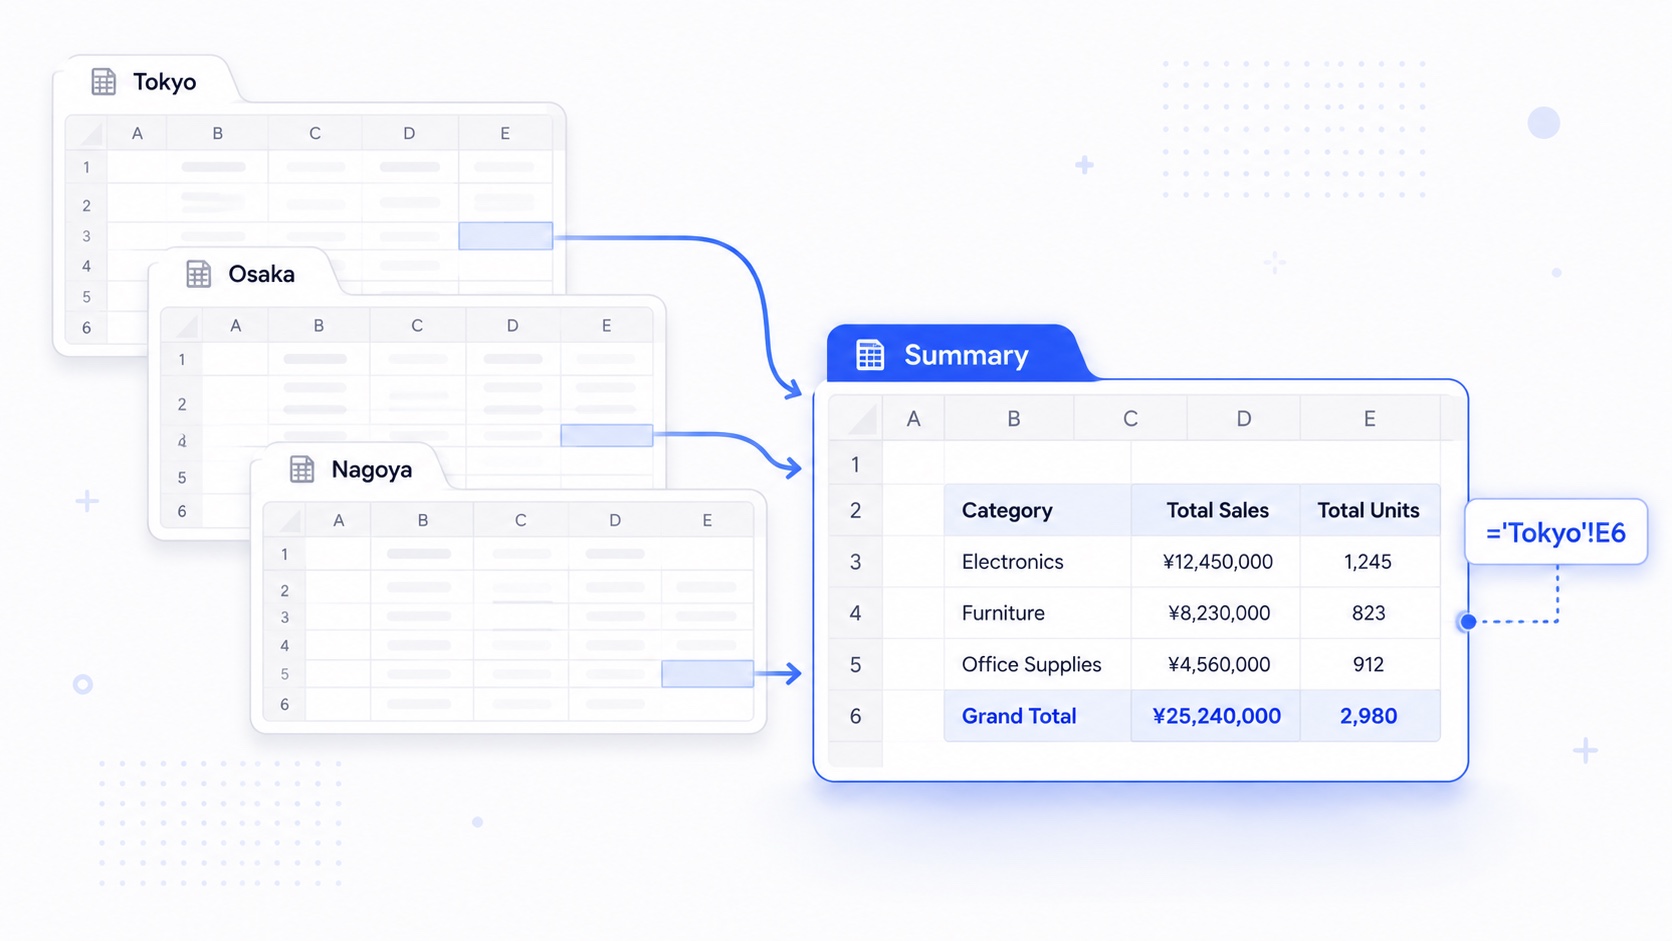
A “regional summary” is one of the most common spreadsheet shapes in business apps: one sheet per branch or department, plus a consolidation sheet that pulls every branch’s totals into one place. Before ReoGrid Web 1.3, you would have wired that consolidation by hand in JavaScript. Now the grid is a workbook of multiple sheets, and a formula on one sheet can reference cells on another — so the summary is just formulas.
In this tutorial we build three branch sheets (Tokyo, Osaka, Nagoya) and a Summary sheet whose every number is a cross-sheet formula. Edit any branch figure, return to Summary, and the totals recalculate across sheets with no extra wiring.
The finished result is the multi-sheet workbook demo. This walkthrough is the trimmed-down version of that code.
1. Create the workbook
Every instance now exposes a workbook coordinator. The first sheet is created for you; add the rest with addSheet, which returns the new sheet so you can grab its worksheet.
import { createReogrid } from '@reogrid/pro';

const BRANCHES = ['Tokyo', 'Osaka', 'Nagoya'];

const grid = createReogrid({
  workspace: '#grid',
  licenseKey: 'YOUR_LICENSE_KEY', // get a Pro key from https://unvell.com/portal
  initialSheetName: BRANCHES[0],   // rename the auto-created first sheet
});

// First sheet is already 'Tokyo'; add the remaining branches.
const sheets = [grid.worksheet];
for (let i = 1; i < BRANCHES.length; i++) {
  sheets.push(grid.workbook.addSheet(BRANCHES[i]).worksheet);
}
The sheet tab bar at the bottom comes for free — it supports add, rename, drag-reorder, hide, and tab color out of the box.
2. Build one branch sheet
Each branch sheet is a small Q1 table: products down the rows, months across the columns, a per-row Q1 Total with =SUM(...), and a bottom Total row. We write numbers with setCellInput (so they stay editable like typed input) and labels with setValue.
const MONTHS = ['Jan', 'Feb', 'Mar'];
const PRODUCTS = ['Laptops', 'Tablets', 'Phones', 'Accessories'];

// sample monthly units, keyed by branch
const DATA: Record<string, number[][]> = {
  Tokyo:  [[52, 55, 60], [31, 30, 34], [40, 44, 47], [18, 17, 20]],
  Osaka:  [[44, 46, 49], [27, 29, 31], [36, 38, 41], [15, 16, 18]],
  Nagoya: [[39, 41, 45], [24, 26, 28], [33, 35, 37], [13, 14, 16]],
};

const header = { bold: true, backgroundColor: '#e2e8f0', textAlign: 'center' } as const;
const totalRow = { bold: true, backgroundColor: '#dbeafe', textAlign: 'right' } as const;

function buildBranch(ws, branch: string) {
  ws.suspendRender();
  ws.setGridSize(2 + PRODUCTS.length, 5); // header + products + total, cols A..E
  ws.column(0).setWidth(140);

  // Header row: branch name + months + "Q1 Total"
  ws.cell('A1').setValue(branch).setStyle({ ...header, textAlign: 'left' });
  MONTHS.forEach((m, i) => ws.cell(0, 1 + i).setValue(m).setStyle(header));
  ws.cell('E1').setValue('Q1 Total').setStyle(header);

  // One row per product; D-column entries + an =SUM Q1 total
  PRODUCTS.forEach((product, p) => {
    const row = 1 + p;               // row index 1.. → A1 rows 2..
    ws.cell(row, 0).setValue(product);
    DATA[branch][p].forEach((v, m) => ws.setCellInput(row, 1 + m, String(v)));
    ws.setCellInput(row, 4, `=SUM(B${row + 1}:D${row + 1})`);
  });

  // Bottom Total row: sum each column over the product rows
  const last = 1 + PRODUCTS.length;  // total row index
  ws.cell(last, 0).setValue('Total').setStyle({ ...totalRow, textAlign: 'left' });
  for (let c = 1; c <= 4; c++) {
    ws.setCellInput(last, c, `=SUM(${String.fromCharCode(66 + c - 1)}2:${String.fromCharCode(66 + c - 1)}${last})`);
    ws.cell(last, c).setStyle(totalRow);
  }

  ws.setFrozenRows(1);
  ws.resumeRender();
}

BRANCHES.forEach((branch, i) => buildBranch(sheets[i], branch));
Two small but important touches: suspendRender() / resumeRender() batch the writes into a single repaint, and setFrozenRows(1) keeps the header visible while scrolling. After this loop, each branch sheet’s E6 cell holds that branch’s Q1 grand total.
3. Consolidate with cross-sheet formulas
This is the part that’s new in 1.3. The Summary sheet doesn’t copy any data — each cell reads the branch sheet directly with a 'Sheet'!Cell reference. Quote the sheet name so the syntax is safe for any name (including non-ASCII ones).
function buildSummary(ws) {
  ws.suspendRender();
  ws.setGridSize(2 + BRANCHES.length, 5);
  ws.column(0).setWidth(140);

  ws.cell('A1').setValue('Branch').setStyle({ ...header, textAlign: 'left' });
  MONTHS.forEach((m, i) => ws.cell(0, 1 + i).setValue(m).setStyle(header));
  ws.cell('E1').setValue('Q1 Total').setStyle(header);

  // One row per branch — every cell pulls that branch's Total row across sheets.
  BRANCHES.forEach((branch, i) => {
    const row = 1 + i;
    ws.cell(row, 0).setValue(branch);
    for (let c = 1; c <= 4; c++) {
      const colLetter = String.fromCharCode(66 + c - 1); // B..E
      const totalRowA1 = 2 + PRODUCTS.length;            // branch Total row in A1
      ws.setCellInput(row, c, `='${branch}'!${colLetter}${totalRowA1}`);
    }
  });

  // Grand total — a plain SUM over the branch rows on THIS sheet.
  const grand = 1 + BRANCHES.length;
  ws.cell(grand, 0).setValue('All Branches').setStyle({ ...totalRow, textAlign: 'left' });
  for (let c = 1; c <= 4; c++) {
    const colLetter = String.fromCharCode(66 + c - 1);
    ws.setCellInput(grand, c, `=SUM(${colLetter}2:${colLetter}${grand})`);
    ws.cell(grand, c).setStyle(totalRow);
  }

  ws.setFrozenRows(1);
  ws.resumeRender();
}

const summary = grid.workbook.addSheet('Summary').worksheet;
buildSummary(summary);

// Land on Summary so the consolidated result is what visitors see first.
grid.workbook.setActiveSheet(BRANCHES.length);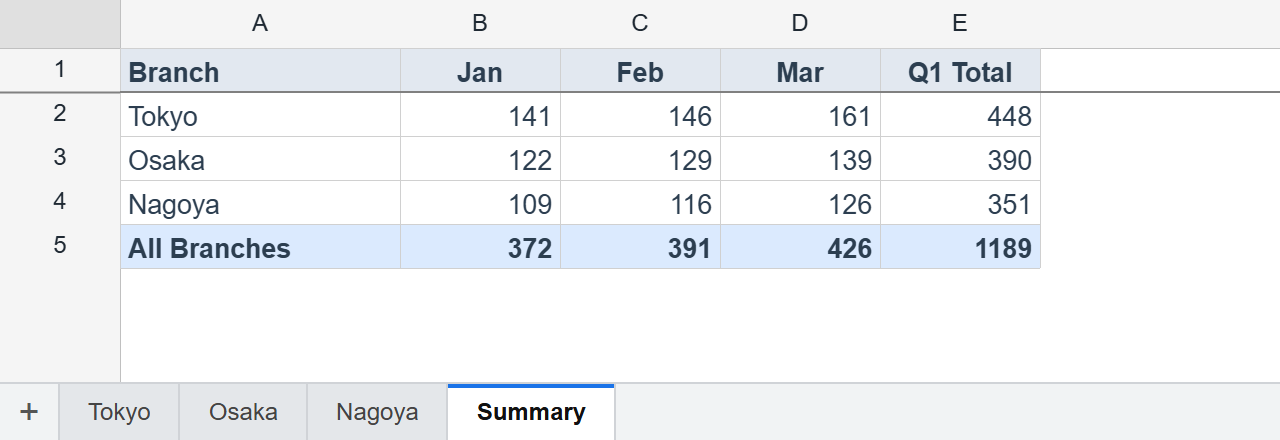
The Summary’s per-branch cells use cross-sheet single-cell references (='Tokyo'!E6); the grand-total row uses an ordinary same-sheet =SUM(...) over those branch rows. You could equally write =SUM(Tokyo!E2:E5) to aggregate a cross-sheet range directly — both styles resolve the same way.
Why this beats wiring it by hand
Because the summary is formulas, not copied values, it stays correct as the workbook changes — the reference lifecycle is Excel-compatible:
- Edit a branch number → its Total recalculates, and the Summary cell that reads it updates across sheets, live.
- Rename a sheet (e.g.
Tokyo→Tokyo HQ) → every='Tokyo'!…reference is rewritten automatically. - Insert/delete rows on a branch → references from the Summary shift to follow.
- Delete a sheet → references to it resolve to
#REF!; a cross-sheet cycle is reported as#CYCLE!.
References resolve case-insensitively, so ='tokyo'!e6 and ='Tokyo'!E6 are the same.
Export the whole workbook
The instance-level I/O works over all sheets at once, so one call writes a single multi-sheet .xlsx — view state (active sheet, hidden sheets, tab colors) round-trips too.
grid.saveAsXlsx({ filename: 'q1-sales.xlsx' });   // all four sheets in one file
await grid.loadFromUrl('/data/q1-sales.xlsx');     // load every sheet back
const doc = grid.toJson();                          // whole-workbook JSON
Wrap-up
Multi-sheet workbooks turn ReoGrid Web from a single grid into the consolidation pattern real business apps need — and cross-sheet formulas mean the consolidation is declarative, not hand-maintained. There are no breaking API changes, and multi-sheet works on both Lite and Pro.