
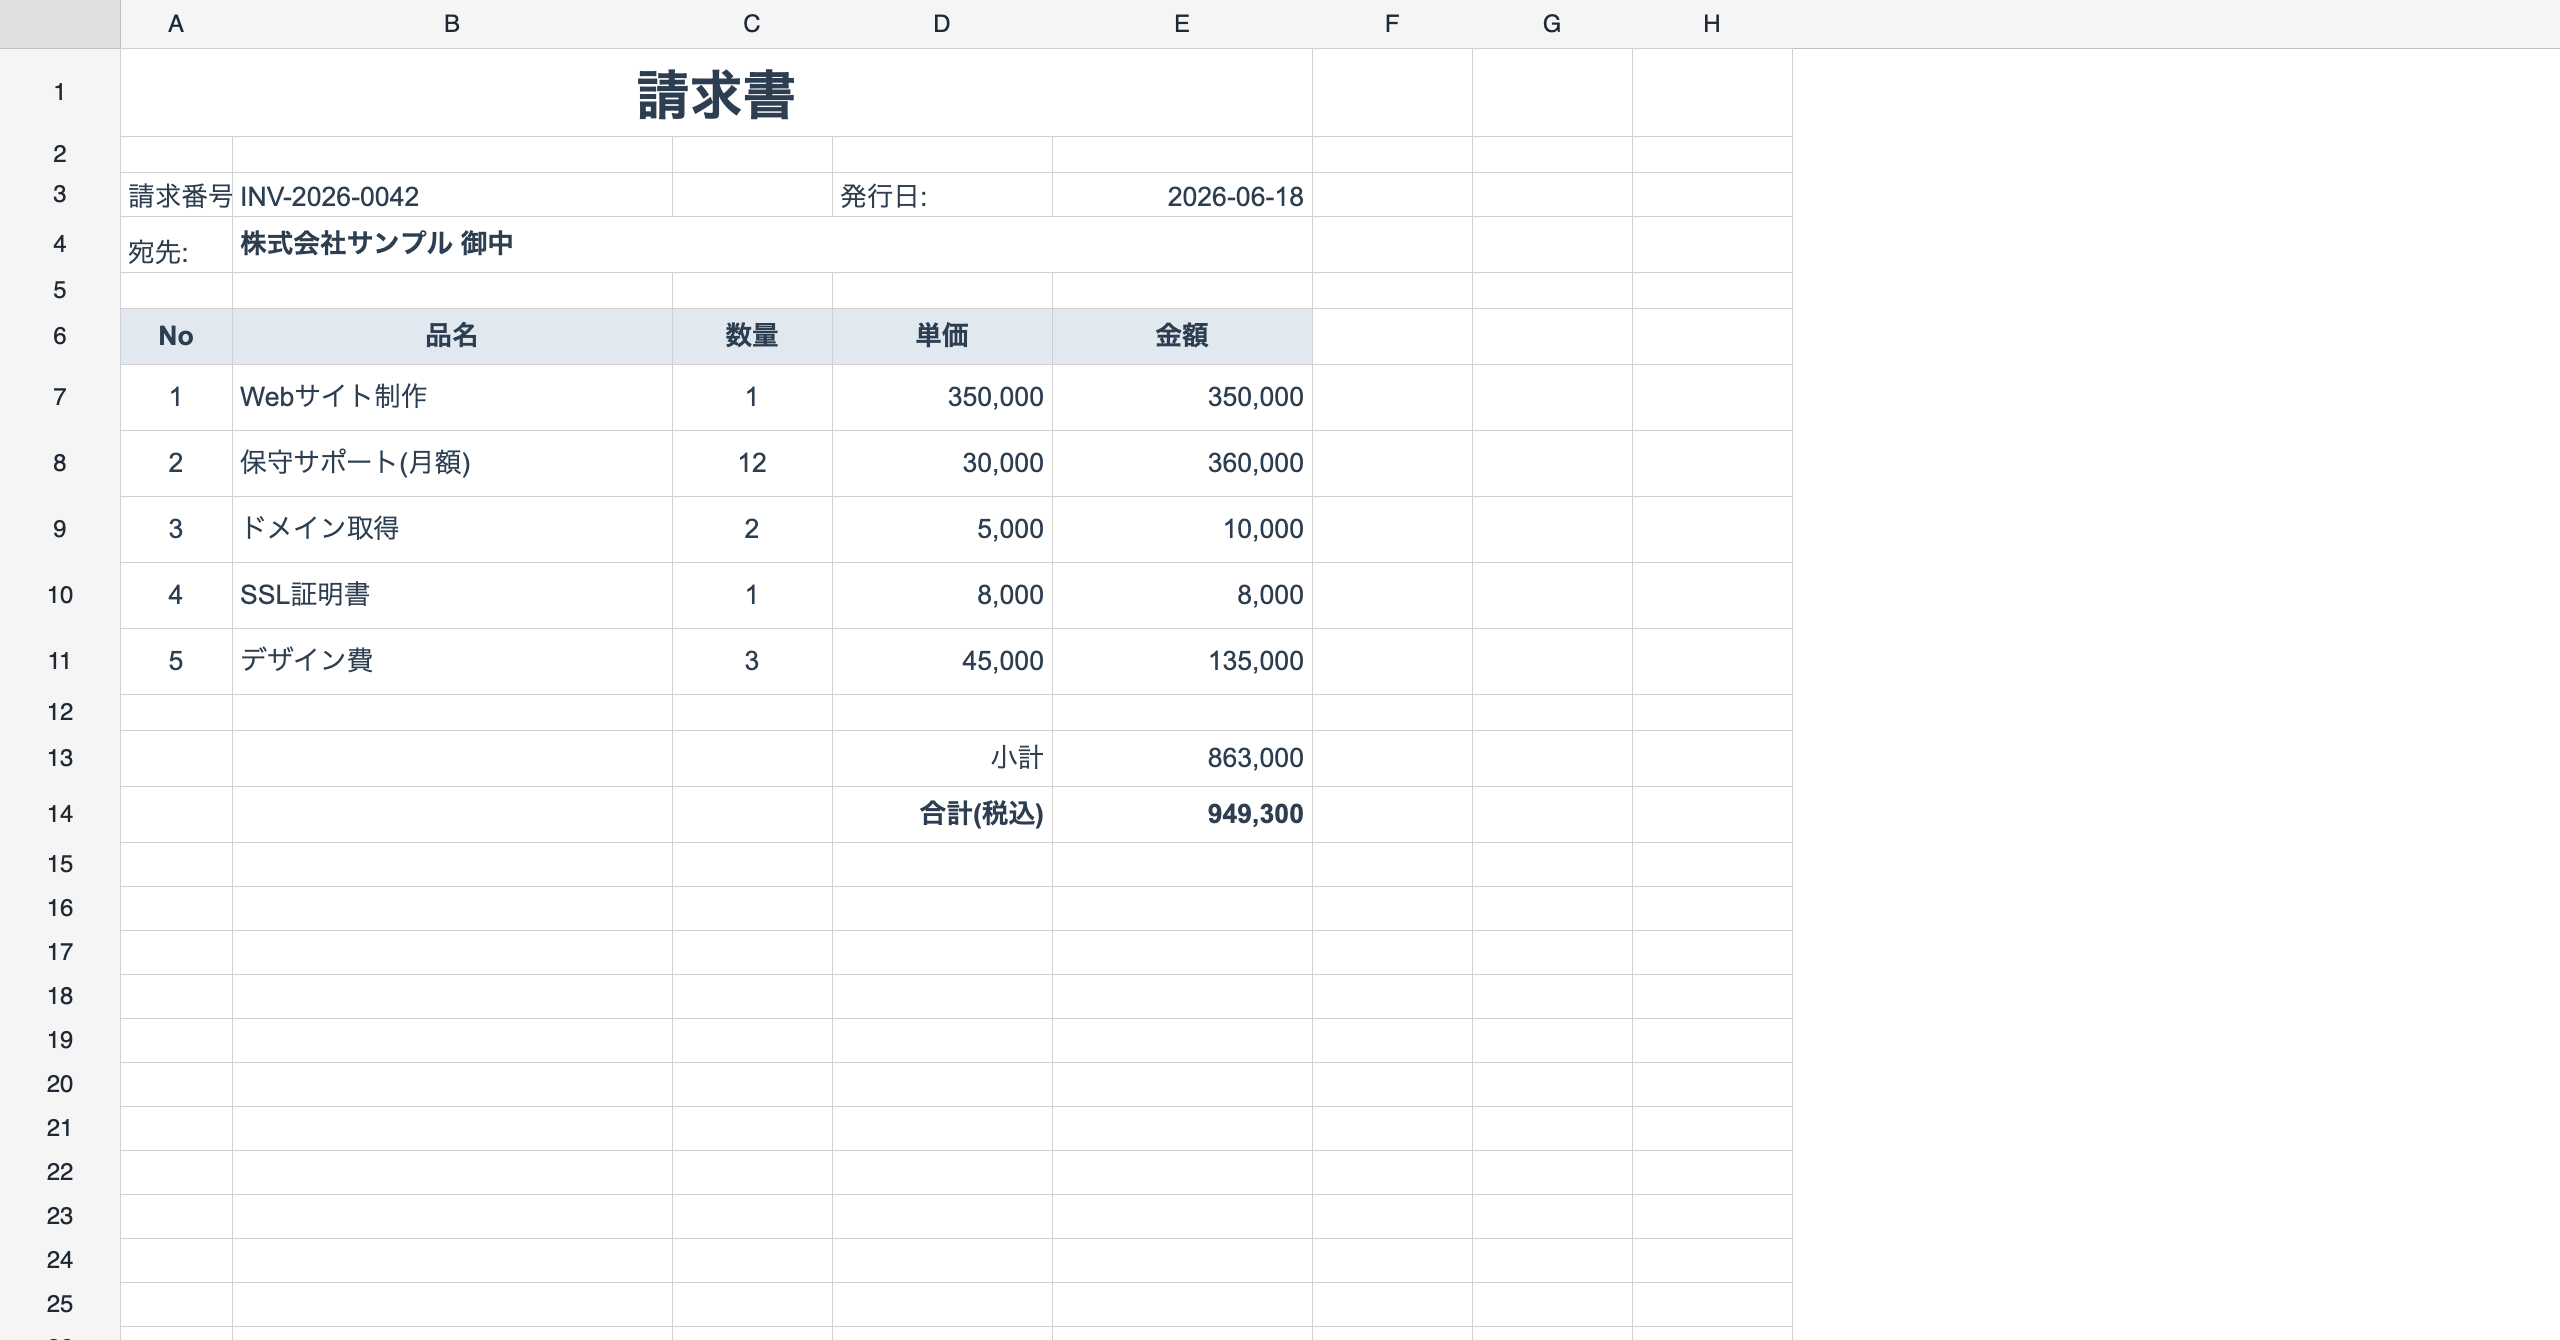
“Email the customer a PDF invoice” looks like a weekend job, and then it turns into infrastructure: a headless Chrome on a server somewhere, a print stylesheet nobody can get to paginate, a font that renders fine locally and as boxes in production. Meanwhile the layout you actually need already exists — someone in accounting drew it in Excel years ago, and it is correct: the tax line is where the tax line goes.
ReoGrid Web takes that as the starting point. Draw the form once on a worksheet, mark which rows repeat, hand it a plain JavaScript object, and export the result as a real vector PDF — all of it client-side, in the same page the user is already looking at.
Report binding and PDF export are Pro features (pricing). The read side —
getReportTemplate/getReportState— works in Lite, and a bound report is plain cells, so a Lite viewer renders it fine.
The whole pipeline, in three calls
import { createReogrid, preloadPdfFont } from '@reogrid/pro';

const grid = createReogrid({ workspace: '#grid', licenseKey: 'YOUR-LICENSE-KEY' });
const ws = grid.worksheet;

// 1. Capture the form you drew on the sheet as a template
ws.defineReportTemplate({
  columns: [0, 4],
  sections: [
    { role: 'header', rows: [0, 5] },
    { role: 'detail', rows: [6, 6], source: 'items' },
    { role: 'footer', rows: [7, 9] },
  ],
});

// 2. Pour data in — the detail band repeats once per record
ws.bindReport({ invoiceNo: 'INV-2026-0042', items: [/* … */] });

// 3. Render to a real, vector PDF
await preloadPdfFont('ja');                       // once, at app start
grid.saveAsPdf({ locale: 'ja', usePageBreaks: true, filename: 'INV-2026-0042.pdf' });
What sits between steps 2 and 3 is worth pausing on: the materialized report is plain cells. Not a canvas overlay, not a print-only DOM tree. So everything else the grid can do still applies to it — formulas recalculate, xlsx export writes the same document to .xlsx, the user can scroll it, and the page-break preview shows exactly what will land on paper.
Step 1 — draw the form once
Type the fixed text straight into the grid, and put {{token}} where a value goes. Nothing is registered up front; the tokens are just cell content.
// Header
ws.cell('A1').setValue('INVOICE');
ws.cell('A3').setValue('No:');      ws.cell('B3').setValue('{{invoiceNo}}');
ws.cell('A4').setValue('Date:');    ws.cell('B4').setValue('{{date}}');
ws.cell('A5').setValue('Bill to:'); ws.cell('B5').setValue('{{customer.name}}');

// Detail — one design row, repeated per item
ws.cell('A7').setValue('{{#index}}');
ws.cell('B7').setValue('{{name}}');
ws.cell('C7').setValue('{{qty}}');
ws.cell('D7').setValue('{{price}}');
ws.cell('E7').setValue('=C7*D7');     // per-row formula — relative refs shift per record

// Footer
ws.cell('D9').setValue('Total');
ws.cell('E9').setValue('=SUM(E7:E7)'); // aggregate expands over the materialized detail range
Four things that decide how the output behaves:
- A cell holding only a token keeps the bound value’s type.
{{qty}}bound to12lands as the number 12, not the string"12"— so number formats, right alignment, and formulas that reference it all keep working. - Dotted paths resolve into the object.
{{customer.name}}readsdata.customer.name. - Two tokens are generated per record in a detail band:
{{#index}}(1-based row number) and{{#count}}(total records) — the line numbers on a printed invoice, without shipping them in your data. - Formulas are written against the design position and shift with it.
=C7*D7on design row 6 becomes=C7*D7,=C8*D8,=C9*D9… as the band repeats, and the footer’s=SUM(E7:E7)expands to cover the whole generated detail range.
Step 2 — say which rows are which band
A template is a list of contiguous bands over 0-based, inclusive design rows:
ws.defineReportTemplate({
  columns: [0, 4],                                          // A:E — the materialized columns
  sections: [
    { role: 'header', rows: [0, 5] },
    { role: 'detail', rows: [6, 6], source: 'items', pageBreakEvery: 20 },
    { role: 'footer', rows: [7, 9] },
  ],
});| Field | Type | Applies to | What it does |
|---|---|---|---|
role | 'header' | 'detail' | 'footer' | all | Which band this is |
rows | [top, bottom] | all | 0-based inclusive design-row range |
source | string | detail | Key into the bound data (dotted paths allowed) — the array that drives repetition |
keepTogether | boolean (default true) | detail | Never split one record across a page boundary |
pageBreakEvery | number | detail | Insert a manual page break after every N records — the fixed-line 帳票 case |
Sections are contiguous, which has one practical consequence worth internalizing: a blank spacer row is a row inside a band, never a gap between two. If you want 12px of air under the customer name, give the header band that row.
A detail band doesn’t have to be one row. Give it rows: [6, 7] and each record materializes as a two-row block — description on top, notes underneath — which is how most real-world 帳票 line items are shaped.
Step 3 — bind the data
ReportData is a plain object. Top-level fields feed header and footer tokens; array fields, keyed by each detail’s source, drive the repetition:
ws.bindReport({
  invoiceNo: 'INV-2026-0042',
  date: '2026-08-31',
  customer: { name: 'Sample Co., Ltd.' },
  items: [
    { name: 'Website build',       qty: 1,  price: 350000 },
    { name: 'Maintenance (month)', qty: 12, price: 30000 },
    { name: 'Domain',              qty: 2,  price: 5000 },
  ],
});
The band expands vertically — rows shift down, columns never move — so a form whose columns are load-bearing (and in a 帳票, they are) can’t drift sideways.
Binding again with different data re-materializes from the captured template; you don’t have to unbind first. That’s the property the batch loop at the end of this article leans on.
ws.unbindReport();     // back to the template view, tokens and all
ws.getReportState();   // 'none' | 'template' | 'bound'
ws.getReportTemplate();
The template is serialized under each sheet in ReoGrid JSON, so a designed form can be saved, shipped to another machine, reloaded, and bound with fresh data there. Design tooling and rendering don’t have to live in the same app.
Making it paginate like paper
A PDF is a stack of pages, so the interesting decisions are about where they break. Set that up with the sheet’s own print settings rather than with export options:
ws.setPrintSettings({
  paperSize: 'A4',
  orientation: 'portrait',
  margins: { top: 12, right: 12, bottom: 12, left: 12 },
  headerFooter: {
    header: { center: 'INVOICE', right: '&D' },
    footer: { center: 'Page &P / &N' },
  },
});
ws.setShowPageBreaks(true);   // draw the page-break preview on screen
The header and footer strings use Excel’s own format codes, expanded per page at render time: &P page number, &N page count, &D date, &T time, &A sheet name, &F file name. Three sections each (left / center / right), top and bottom — the same layout Excel’s own page setup dialog gives you. (Page header/footer arrived in v1.5; report binding and PDF export in v1.4.)
For breaks, you have two levers that answer different questions:
pageBreakEvery: 20on the detail band — “this form holds exactly 20 lines per page”. The classic fixed-form 帳票 requirement, and it wins over content height.keepTogether: true(the default) — “whatever else happens, never split one record”. Leave it on unless a single record is genuinely taller than a page.
Turning on setShowPageBreaks(true) matters more than it looks: with usePageBreaks: true on export, what the user sees on screen and what comes out of the PDF are computed from the same paging model. No “looked fine in the browser” surprises.
Exporting the PDF
import { preloadPdfFont } from '@reogrid/pro';

await preloadPdfFont('ja');    // once, at an async point you control

grid.saveAsPdf({ locale: 'ja', usePageBreaks: true, filename: 'INV-2026-0042.pdf' });
Two things about this call surprise people, and both are deliberate.
A font is required — even for an all-Latin invoice. The renderer embeds glyph outlines into the PDF itself, which is what makes it render identically on a machine with no fonts installed. Name a locale ('ja', 'zh-CN', 'zh-TW', 'ko' are registered out of the box) or pass your own TrueType bytes in font; without one of the two, the export throws. Noto Sans JP covers Latin as well, so 'ja' is a perfectly good default for an English invoice — though for a Latin-only document, registering a smaller font of your own is the cheaper download.
The export itself is synchronous. saveAsPdf ends in a click on a generated link, and an await before that click loses the user-gesture context — popup blockers eat the download. So the font fetch is a separate, explicit step you pay once at app start, and every export afterwards is instant. For production, skip the CDN entirely with the subset packages, which put the bytes on npm:
// npm install @reogrid/font-jp   (also font-sc → 'zh-CN', font-tc → 'zh-TW', font-kr → 'ko')
import { registerPdfFont, preloadPdfFont } from '@reogrid/pro';
import { loadNotoSansJP } from '@reogrid/font-jp';

registerPdfFont('ja', loadNotoSansJP);
await preloadPdfFont('ja');
Want the bytes instead of a download — to upload, archive, or preview inline? exportPdf returns them:
const bytes: Uint8Array = grid.exportPdf({ locale: 'ja', usePageBreaks: true });

await fetch('/api/invoices/INV-2026-0042.pdf', {
  method: 'POST',
  headers: { 'Content-Type': 'application/pdf' },
  body: bytes,
});
Each file embeds only the glyphs it actually uses — the font is subset at export time — so a stack of invoices doesn’t carry a multi-megabyte font each.
Worked example: the whole invoice
Everything above, as one file. Columns A–E, header rows 0–5, one repeating detail row, footer rows 7–9, and two buttons.
import { createReogrid, preloadPdfFont } from '@reogrid/pro';
import type { ReportData } from '@reogrid/pro';

const grid = createReogrid({ workspace: '#grid', licenseKey: 'YOUR-LICENSE-KEY' });
const ws = grid.worksheet;

const NUM = '#,##0';
ws.suspendRender();
[56, 240, 70, 110, 130].forEach((w, i) => ws.column(i).setWidth(w));

// ── Header band: design rows 0–5 ──────────────────────────────────────────
ws.setCellInput(0, 0, 'INVOICE');
ws.mergeCells(0, 0, 0, 4);
ws.setCellStyle(0, 0, { bold: true, fontSize: 20, textAlign: 'center', verticalAlign: 'middle' });
ws.row(0).setHeight(44);
ws.row(1).setHeight(12);                                  // spacer — inside the band
ws.setCellInput(2, 0, 'No:');       ws.setCellInput(2, 1, '{{invoiceNo}}');
ws.setCellInput(2, 3, 'Date:');     ws.setCellInput(2, 4, '{{date}}');
ws.setCellInput(3, 0, 'Bill to:');  ws.setCellInput(3, 1, '{{customer.name}}');
ws.mergeCells(3, 1, 3, 4);
ws.setCellStyle(3, 1, { bold: true, verticalAlign: 'middle' });
ws.row(4).setHeight(12);
['No', 'Item', 'Qty', 'Unit price', 'Amount'].forEach((h, c) => {
  ws.setCellInput(5, c, h);
  ws.setCellStyle(5, c, {
    bold: true, backgroundColor: '#1e3a5f', color: '#ffffff',
    textAlign: 'center', verticalAlign: 'middle',
  });
});

// ── Detail band: design row 6 (== A1 row 7), repeated per item ─────────────
ws.setCellInput(6, 0, '{{#index}}');
ws.setCellInput(6, 1, '{{name}}');
ws.setCellInput(6, 2, '{{qty}}');
ws.setCellInput(6, 3, '{{price}}');
ws.setCellInput(6, 4, '=C7*D7');
[2, 3, 4].forEach(c => ws.setCellNumberFormat(6, c, NUM));
ws.setCellStyle(6, 0, { textAlign: 'center' });
[3, 4].forEach(c => ws.setCellStyle(6, c, { textAlign: 'right' }));

// ── Footer band: design rows 7–9 ──────────────────────────────────────────
ws.row(7).setHeight(12);
ws.setCellInput(8, 3, 'Subtotal');          ws.setCellInput(8, 4, '=SUM(E7:E7)');
ws.setCellInput(9, 3, 'Total (incl. tax)'); ws.setCellInput(9, 4, '=E9*1.1');
[8, 9].forEach(r => {
  ws.setCellNumberFormat(r, 4, NUM);
  ws.setCellStyle(r, 3, { textAlign: 'right' });
  ws.setCellStyle(r, 4, { textAlign: 'right' });
});
ws.resumeRender();

// ── Template + paper ──────────────────────────────────────────────────────
ws.defineReportTemplate({
  columns: [0, 4],
  sections: [
    { role: 'header', rows: [0, 5] },
    { role: 'detail', rows: [6, 6], source: 'items', pageBreakEvery: 20 },
    { role: 'footer', rows: [7, 9] },
  ],
});

ws.setPrintSettings({
  paperSize: 'A4',
  orientation: 'portrait',
  headerFooter: { footer: { center: 'Page &P / &N', right: '&D' } },
});
ws.setShowPageBreaks(true);

void preloadPdfFont('ja');   // warm the font cache while the user reads the form

// ── Data in, PDF out ──────────────────────────────────────────────────────
const invoice: ReportData = {
  invoiceNo: 'INV-2026-0042',
  date: '2026-08-31',
  customer: { name: 'Sample Co., Ltd.' },
  items: [
    { name: 'Website build',       qty: 1,  price: 350000 },
    { name: 'Maintenance (month)', qty: 12, price: 30000 },
    { name: 'Domain',              qty: 2,  price: 5000 },
  ],
};

document.getElementById('render')!.onclick = () => ws.bindReport(invoice);
document.getElementById('pdf')!.onclick = () =>
  grid.saveAsPdf({ locale: 'ja', usePageBreaks: true, filename: `${invoice.invoiceNo}.pdf` });
Click render and the three line items appear with their numbers, per-row amounts, and an expanded subtotal. Click pdf and the same thing lands in the downloads folder, paginated where the on-screen preview said it would be. The report binding demo runs this shape live — bind 5 records, bind 20, unbind, save — and the PDF & page layout demo shows the paging and header/footer side.
One template, a hundred invoices
Because binding re-materializes from the captured template, a whole month’s billing run is a loop. No server, no queue:
await preloadPdfFont('ja');   // once — the bytes are cached from here on

const files: { name: string; bytes: Uint8Array }[] = [];

for (const invoice of invoices) {
  ws.bindReport(invoice);                                        // re-fill the same form
  files.push({
    name: `${invoice.invoiceNo}.pdf`,
    bytes: grid.exportPdf({ locale: 'ja', usePageBreaks: true }),
  });
  await new Promise(resolve => setTimeout(resolve));             // let the UI breathe
}
bindReport and exportPdf are both synchronous, so the setTimeout(0) between records is what keeps a long run from freezing the tab — drop it for a handful of documents, keep it for a hundred and drive a progress bar off the loop index. What you do with files is up to you: POST them somewhere, zip them client-side, or hand them straight to the user.
Where Lite ends and Pro begins
| Operation | Lite (free) | Pro |
|---|---|---|
| Rendering a bound report — it’s plain cells | ✅ | ✅ |
Reading the template and state (getReportTemplate, getReportState) | ✅ | ✅ |
defineReportTemplate / bindReport / unbindReport | — | ✅ |
exportPdf / saveAsPdf | — | ✅ |
The same split as pivot tables and data validation: authoring carries the license, rendering doesn’t. A Pro-licensed back office can design forms and issue documents while a Lite-based viewer elsewhere displays them.
Wrapping up
The layout your business actually uses is already drawn — the work is wiring data into it and getting paper out the other end. Three calls do that here: defineReportTemplate captures the form, bindReport repeats the detail band per record with formulas that shift and totals that expand, and saveAsPdf renders a vector PDF that breaks pages exactly where the preview said. Page header/footer in Excel format codes, fixed lines per page, CJK fonts by locale, and a batch loop when one document isn’t enough — with no server in the path and no file leaving the browser.
Start with the report binding demo and the PDF & page layout demo, then the full APIs in the report binding and PDF export docs. For the shorter versions: Fill a Report Template and Export a PDF. And if the form you want to bind is currently an .xlsx sitting on someone’s desktop, moving Excel layout forms to the web is the article to read first.