In the previous article we carried the look of an Excel-grid form to the web without rebuilding it. This time we make the sheet move: the ☑ attendance check, the work-type pick list, the utilization bar. Excel business sheets are full of these interactive controls — and you can implement them directly inside cells, without laying out HTML form elements one by one.
What are cell types?
Most business sheets don’t just display values. They have UI you operate: click to toggle, pick to enter, glance to read a status.
Cell types in ReoGrid Web bring this to individual cells. Checkboxes and dropdowns are drawn straight onto the canvas — no DOM overlays — so they scroll at the same speed as ordinary cells even at ten thousand rows.
Eight types are built in:
| Type | Description |
|---|---|
checkbox | Checkbox (click to toggle between true / false) |
dropdown | Dropdown (picking an option writes the value into the cell) |
button | Button (label and click handler) |
progress | Progress bar (visualizes numeric values) |
rating | Star rating (click to change the value) |
sparkline-line | Line sparkline |
sparkline-area | Area sparkline |
hyperlink | Hyperlink (click to open a URL) |
Cell types are a Pro feature (pricing). The code in this article assumes
@reogrid/pro.
Basic usage
Assign a type with setCellType(row, col, config) and set values with the usual setCellInput. Arguments are 0-based (row, column).
import { createReogrid } from '@reogrid/pro';

const { worksheet } = createReogrid('#grid');

// Checkbox (values are lowercase 'true' / 'false')
worksheet.setCellType(0, 0, { type: 'checkbox' });
worksheet.setCellInput(0, 0, 'true');

// Progress bar
worksheet.setCellType(1, 0, { type: 'progress', max: 100, color: '#3b82f6' });
worksheet.setCellInput(1, 0, '75');

// The CellHandle chaining style works too
worksheet.cell('A3').setType({ type: 'rating', maxStars: 5 }).setValue('4');
Worked example: an attendance sheet
Let’s build one week of the most familiar “interactive Excel” in any office: an attendance sheet. Attendance checkboxes, work-type dropdowns, hours, totals, and a utilization bar — this is the complete code.
import { createReogrid } from '@reogrid/pro';

const { worksheet } = createReogrid('#grid');

worksheet.suspendRender(); // batch the initial render

// ── Columns ──
worksheet.column('A').width = 110; // Date
worksheet.column('B').width = 56;  // Present
worksheet.column('C').width = 110; // Work type
worksheet.column('D').width = 80;  // Hours
worksheet.column('E').width = 180; // Notes

// ── Title (merge A1:E1) ──
worksheet.range('A1:E1')
  .merge()
  .setValue('Attendance — June 2026, Week 1')
  .setStyle({ bold: true, fontSize: 16, textAlign: 'center', verticalAlign: 'middle', color: '#1e3a5f' });
worksheet.row(0).height = 40;

// ── Header (row 3) ──
['Date', 'Present', 'Work type', 'Hours', 'Notes'].forEach((h, c) => {
  worksheet.cell(2, c).setValue(h);
});
worksheet.range('A3:E3').setStyle({ bold: true, textAlign: 'center', backgroundColor: '#eef2f7', color: '#1e3a5f' });

// ── Detail rows (Mon 6/1 – Sun 6/7) ──
const days = [
  { date: 'Mon, Jun 1', weekend: false },
  { date: 'Tue, Jun 2', weekend: false },
  { date: 'Wed, Jun 3', weekend: false },
  { date: 'Thu, Jun 4', weekend: false },
  { date: 'Fri, Jun 5', weekend: false },
  { date: 'Sat, Jun 6', weekend: true },
  { date: 'Sun, Jun 7', weekend: true },
];

days.forEach((d, i) => {
  const r = 3 + i; // 0-based rows 3–9 = A1-style rows 4–10

  worksheet.cell(r, 0).setValue(d.date);

  // Attendance checkbox
  worksheet.setCellType(r, 1, { type: 'checkbox' });
  worksheet.setCellInput(r, 1, d.weekend ? 'false' : 'true');
  worksheet.cell(r, 1).setStyle({ textAlign: 'center' });

  // Work-type dropdown (the picked option is written into the cell)
  worksheet.setCellType(r, 2, {
    type: 'dropdown',
    options: ['Office', 'Remote', 'PTO', 'Day off'],
  });
  worksheet.setCellInput(r, 2, d.weekend ? 'Day off' : 'Office');

  // Hours worked
  worksheet.setCellInput(r, 3, d.weekend ? '0' : '8');

  // Tint weekend rows
  if (d.weekend) {
    worksheet.range(r, 0, r, 4).setStyle({ backgroundColor: '#fdf2f4' });
  }
});

worksheet.range('A4:E10').border({ style: 'solid', color: '#cbd5e1' });

// ── Totals ──
worksheet.cell('A12').setValue('Days worked').setStyle({ bold: true });
worksheet.setCellInput(11, 1, '=COUNTIF(C4:C10,"Office")+COUNTIF(C4:C10,"Remote")');

worksheet.cell('A13').setValue('Total hours').setStyle({ bold: true });
worksheet.setCellInput(12, 1, '=SUM(D4:D10)');

// ── Utilization bar (a formula-driven progress bar) ──
worksheet.cell('A14').setValue('Utilization (40h wk)').setStyle({ bold: true });
worksheet.range('B14:E14').merge();              // merge for a wide bar
worksheet.setCellType(13, 1, { type: 'progress', max: 100, color: '#3b82f6' });
worksheet.setCellInput(13, 1, '=SUM(D4:D10)/40*100');

worksheet.resumeRender();
A few things worth noting:
- Checkbox values are lowercase
'true'/'false'. Clicking toggles automatically, and only the box area reacts — row selection and copying work as usual. - The dropdown opens from the ▼ button at the right edge of the cell, and the picked option is written into the cell. Since the value is just text, you can aggregate it straight from formulas like
COUNTIF(C4:C10,"Office"). - A progress bar’s value can be a formula. The bar renders the computed display value, so editing the hours makes the utilization bar grow and shrink live.
- Cell types apply to merged ranges too. Merge
B14:E14first and the bar draws across the whole merged area.
Reacting to edits — event wiring
Want to save to the server the moment a box is toggled, or surface totals elsewhere in your UI? Subscribe with onCellValueChange. Checkbox toggles and dropdown picks arrive as the same event as ordinary cell edits.
const off = worksheet.onCellValueChange(({ row, column, value }) => {
  if (column === 1) {
    // Attendance toggled (value is 'true' / 'false')
    console.log(`${worksheet.getDisplayText(row, 0)} present: ${value}`);
  }
  if (column === 3) {
    // Hours edited → read the computed total
    const total = worksheet.getDisplayText(12, 1); // B13 = total hours
    console.log(`Total hours: ${total}`);
  }
});

// Call the returned function to unsubscribe
off();
To read a formula cell’s computed result, use getDisplayText(row, col) (formatted text) or getCellNumericValue(row, col) (the number). Note that cell(...).value returns the raw input — for a formula cell that’s the =SUM(...) string.
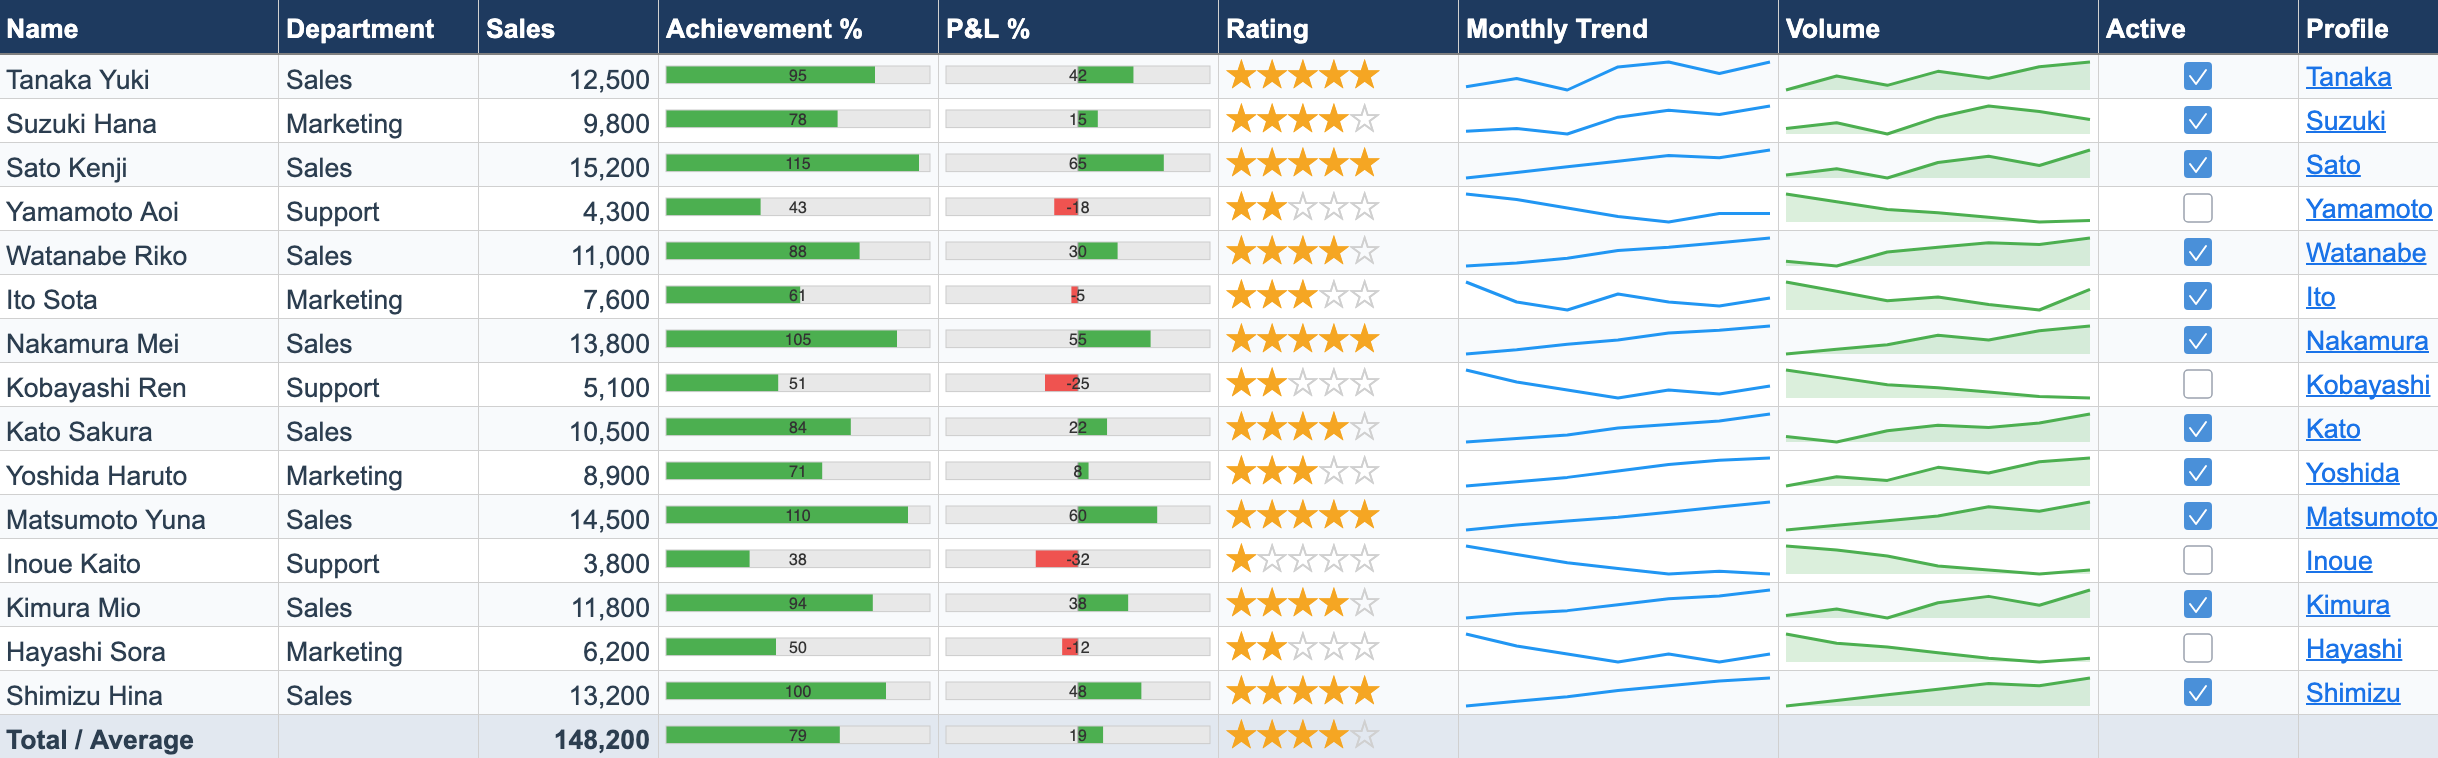
The other four — great for dashboards
We didn’t need these in the attendance sheet, but they shine in progress dashboards and task lists.
// Star rating (clickable)
worksheet.setCellType(0, 0, { type: 'rating', maxStars: 5 });
worksheet.setCellInput(0, 0, '4');

// Sparkline (value is a comma-separated list of numbers)
worksheet.setCellType(1, 0, { type: 'sparkline-area', color: '#3b82f6', fillColor: 'rgba(59,130,246,0.2)' });
worksheet.setCellInput(1, 0, '10,20,15,30,25,35');

// Hyperlink ("display text|URL" format)
worksheet.setCellType(2, 0, { type: 'hyperlink' });
worksheet.setCellInput(2, 0, 'Intranet|https://example.com');

// Button
worksheet.setCellType(3, 0, {
  type: 'button',
  label: 'Submit',
  onClick: () => { /* submit flow */ },
});
If eight types aren’t enough, you can implement the CellTypeHandler interface and register your own — you draw straight onto the canvas, so traffic lights, status badges, anything goes. See the cell types documentation.
Where Lite ends and Pro begins
| Operation | Lite (free) | Pro |
|---|---|---|
| xlsx import, merges, borders, number formats | ✅ | ✅ |
Arithmetic formulas (=D4*1.25) | ✅ | ✅ |
Cell types (setCellType, all 8) | — | ✅ |
Built-in functions (SUM, COUNTIF, …) | — | ✅ |
xlsx export (saveAsXlsx) | — | ✅ |
Displaying, editing, and loading xlsx all work in the free Lite tier. Drawing UI inside cells is where Pro begins.
Wrapping up
The interactive controls of an Excel business sheet — checkboxes, dropdowns, progress bars — don’t need to be rebuilt as HTML forms. As cell types they live inside the grid; their values are plain cell values, so formulas can aggregate them and onCellValueChange connects them to your app.
Try all eight in the cell types demo, or see the attendance sheet demo for a full month with weekend coloring. For carrying a form’s layout to the web, see the previous article.
▶ Run it locally: the code in this article is a ready-to-run React project in unvell/web-spreadsheet-reogrid-samples — git clone, npm install && npm run dev, then open the Cell types sample. Browse all live demos too.