
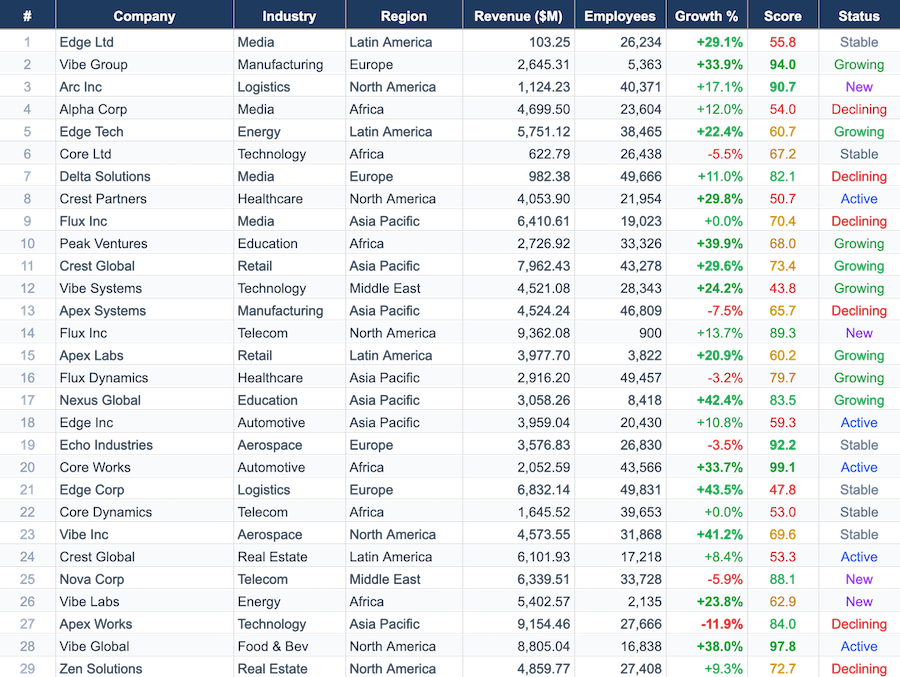
A user clicks a button. 10,000 rows of data — companies, regions, revenue, growth, status — appear in a spreadsheet. They start scrolling. The frame rate stays at 60fps. They sort by revenue. It re-renders in under 100 ms.
That is the Big Data demo on this site, running live in your browser. This post is about how it works, and why it works.
The DOM is the wrong tool for dense grids
A DOM-based grid has a structural problem: every visible cell is a <div> (or <td>), and the browser’s layout/style/paint pipeline is on the critical path of every scroll and every value change. Virtualized grids paper over this by recycling DOM nodes for visible rows only, which works — until you cross-cut the grid with merged cells, frozen panes, conditional formatting, and per-cell borders. Each layer adds DOM nodes the recycler has to keep in sync.
ReoGrid Web is a single <canvas> element. There is no DOM per cell. The renderer walks the visible rectangle of the worksheet and draws it directly into the 2D context. Scrolling is a redraw, not a reflow. Sorting 10,000 rows and re-rendering them is O(visible cells) regardless of the total row count.
What the Big Data demo actually does
Here is the load path, abridged from big-data.example.ts:
import { createReogrid } from '@reogrid/pro';

const { worksheet: ws } = createReogrid({
  workspace: '#grid',
  licenseKey: 'YOUR_LICENSE_KEY',
});

ws.setGridSize(10_002, 9);            // 10,000 rows + header + buffer

const data: Row[] = generateRows(10_000);

function renderData(rows: Row[]) {
  ws.suspendRender();                  // ← coalesce paints
  rows.forEach((d, i) => {
    const r = i + 1;
    ws.cell(r, 1).setValue(d.name);
    ws.cell(r, 4).setValue(d.revenue.toLocaleString());
    ws.cell(r, 6)
      .setValue(`${d.growth >= 0 ? '+' : ''}${d.growth.toFixed(1)}%`)
      .setStyle({ color: d.growth >= 0 ? '#16a34a' : '#dc2626', bold: Math.abs(d.growth) >= 20 });
    // …other columns
  });
  ws.resumeRender();                   // ← single paint
}

const t0 = performance.now();
renderData(data);
ws.setFrozenRows(1);
console.log(`Initial load: ${(performance.now() - t0).toFixed(0)}ms`);
Two things matter here.
1. suspendRender() / resumeRender()
Without bracketing the bulk write, every setValue schedules a repaint. Even at requestAnimationFrame rates, that is 60 wasted paints per second while the loop is filling. With suspend/resume, the renderer paints exactly once after the loop completes.
2. Style payloads, not DOM mutations
setStyle({ color: '#16a34a' }) updates the cell’s style record. It does not toggle a className, add a node, or touch the DOM. The next paint reads the new color from the record and draws it.
For datasets larger than memorywise reasonable in this pattern, bulkSetCells() is the dedicated bulk-load API and fires onBulkCellsChange exactly once instead of per cell.
The per-frame cost: where v1.2 cut 70% of canvas calls
Drawing 10,000 cells without overhead is necessary but not sufficient. The harder problem is what happens during scroll: the renderer walks the new visible window every frame, and every per-cell call into the canvas API has a measurable cost. ctx.font = '…' triggers font shaping. ctx.measureText() runs a text measurement pass. Both add up fast on a dense sheet.
v1.2 introduced per-frame caches for these. Measured per frame on a 1200×100 sheet (text-heavy, mixed styles):
| Canvas API | v1.1 | v1.2 | Reduction |
|---|---|---|---|
ctx.font= | 129 | 34 | −74% |
ctx.fillStyle= | 179 | 46 | −74% |
ctx.measureText() | 126 | 35 | −72% |
save() / restore() | 122 | 85 | −30% |
The cache key is just the string itself — the renderer skips the assignment when the value would not change. There is also a per-frame cache for wrapped/multi-line text layout that removes a per-token measureText loop that previously ran every frame for every visible wrapped cell. Single-line text takes a fast path that skips the layout cache entirely.
The user-visible effect: scroll frames that previously dropped to 45–50fps on dense sheets stay pegged at 60fps, and CPU utilization on a backgrounded tab drops noticeably.
Sorting 10,000 rows and re-rendering
In the demo, sort is done in JS land and the result is re-rendered via the same renderData() path:
const t0 = performance.now();
const sorted = [...data].sort((a, b) => b.revenue - a.revenue);
renderData(sorted);
const elapsed = performance.now() - t0;
// → ~60–120ms total, includes sort + full re-render
Two reasons this is fast despite re-painting every cell:
- The sort is in plain memory. No grid roundtrip, no event ping-pong.
renderData()is bracketed bysuspendRender()/resumeRender(), so the bulk-write path runs once.
For sheets where the data lives in the grid itself rather than in a JS array, ReoGrid Web also has a built-in worksheet.sortColumn(column, order) API (Pro) that operates on the canvas-backed cell store directly.
Frozen rows are free
ws.setFrozenRows(1);The header stays put while you scroll. There is no perf cost: the renderer already maintains separate viewports for the frozen and scrolling panes (ViewportController), and freezing just toggles which viewport a row belongs to. Same applies to frozen columns and the four-pane frozen split.
What this is not
Honest disclosure: ReoGrid Web is a spreadsheet, not a database table viewer.
- One million rows is out of scope. The use case is editable, Excel-compatible documents — invoices, budgets, dashboards, configuration sheets, internal tools. If you need to scroll through a billion log lines, you want a different abstraction (e.g. a virtualized table with sticky scroll position). Update (June 2026): we changed our mind about this one — see One million rows in a browser spreadsheet for the delay-load data source that made it possible.
- Cells store values and styles, not DOM nodes. If you need to embed full React components inside cells (a date picker, a custom form), ReoGrid’s cell-type registry can host interactive widgets (checkbox, dropdown, button, progress, rating, sparkline, link) but is not a substitute for a DOM-tree-per-cell grid.
For the use case it is built for — Excel-fidelity editing in the browser at interactive speed — it holds 60fps on workloads where DOM-virtualized grids start to fight their own rendering pipeline.
Try it
The Big Data demo loads 10,000 rows live, with sort buttons that include the re-render time in their stopwatch. Click around. Scroll. The DevTools performance panel will tell you the rest.
For your own project:
npm install @reogrid/lite     # free, 100 rows × 26 cols
# or
npm install @reogrid/pro      # full features, including 10k+ row sheets
Next up in this series: how to import a real .xlsx file in the browser without sending it to a server — drag-and-drop, no uploads, full Excel fidelity.
▶ Run it locally: the code in this article is a ready-to-run React project in unvell/web-spreadsheet-reogrid-samples — git clone, npm install && npm run dev, then open the 10,000 rows sample. Browse all live demos too.